
Well over half way into 2024, What now?
Well over half way into 2024, What now?
Part 2

Introduction
Hi friends,
I hope you didn’t lose your shirt since our last post 2 days ago. The economic data wasn’t great and with rising tensions in the Middle-East we are in for some volatility!
Remember: “With volatility comes opportunity” ~ Stock Info
If you haven’t read Part 1 consider doing so by clicking HERE. Without further ado, here is part 2 of the macro analysis as promised!
The Federal Headache
The U.S. economy is definitely alive, with GDP growth reaching 2.8% in the second quarter of 2024. This is a noticeable jump from the previous quarter's 1.4%, indicating a strong recovery.
This growth is largely driven by consumer spending, which accounts for about 70% of the economy, along with investments in businesses and inventories. When people are confident in their incomes and job security, they tend to spend more, which in turn helps businesses grow, leading to more hiring and further investment.
If wage growth stays steady and inflation continues to ease, the Federal Reserve might consider cutting interest rates. This could lower borrowing costs, encouraging consumers and businesses to spend and invest more, typically boosting assets like stocks and real estate.
On the topic of inflation, the PCE, the preferred inflation parameter by the Fed, was at 2.6% YoY in June 2024. This is slightly down from May's 2.60% and significantly lower than 3.20% a year ago.
The PCE is comprehensive as it covers a wide range of goods and services, providing a good indicator of actual consumer spending habits. However, despite this decrease, inflation remains somewhat "sticky," meaning it's not dropping as quickly as one might hope.
This stickiness complicates the Federal Reserve's decision-making process regarding interest rates. If they cut rates too soon, it could rekindle inflation; if they wait too long, it might hinder economic growth. The Fed must carefully balance these factors, considering various economic indicators and consumer behavior.
The personal saving rate, which measures the portion of disposable income that households save, has been around 3.4%. This historically low rate suggests that while people are spending, and they aren't saving much. This could be due to several reasons, such as confidence in the economy, rising living costs, or simply a preference for spending over saving.
Economically, a lower saving rate can boost the economy because more money is being spent. However, it also means households are more vulnerable to financial shocks if inflation doesn't ease or the economy experiences unexpected downturns, potentially leading to financial stress for many families.
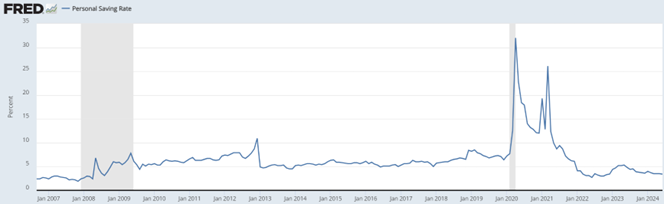
Overall, although the savings rate is low, bank deposits are still huge, as seen here:
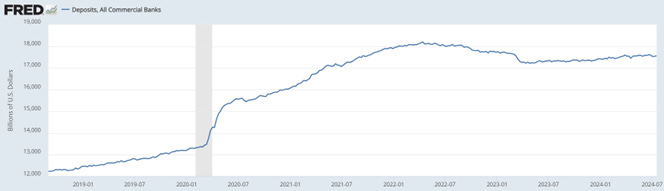
So, while the savings rate is low, deposits remain strong, and thus, widespread defaults are unlikely.
The timing of potential Federal Reserve rate cuts will be crucial in supporting growth without letting inflation get out of control again. This situation represents a classic economic balancing act, and the outcomes could significantly affect the broader economy and individual financial situations.
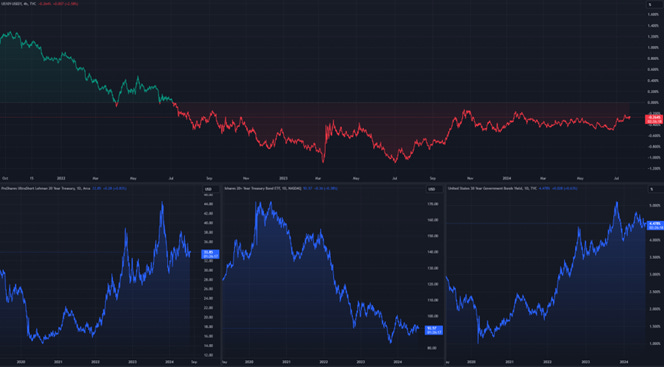
Additionally, the yield curve, specifically the spread between the 10-year and 2-year U.S. Treasury yields, is currently around -0.195% and is moving towards 0%. This inversion, where short-term rates are higher than long-term rates, is beginning to correct. Such a shift suggests changing expectations among investors regarding economic growth and monetary policy.
A movement towards a normal, upward-sloping yield curve often indicates a more optimistic outlook for future economic growth. In economic theory, a steeper yield curve can reflect expectations of stronger economic performance and potentially higher inflation.
Investors demand higher yields for longer-term bonds to compensate for the anticipated risk of inflation and economic expansion, which typically drive up long-term interest rates.
From a monetary policy perspective, the normalization of the yield curve may signal that the Federal Reserve's cycle of rate hikes is slowing down or nearing its end. If the curve continues to move towards and crosses into positive territory, it might indicate market expectations for future rate cuts, particularly if there are concerns about an economic slowdown or the need for policy support to sustain growth.
A steepening yield curve has several implications for financial markets. A steeper curve can boost banks' earnings potential in the equity market, particularly within the financial sector. This is because banks profit from the difference between the rates at which they borrow (short-term) and lend (long-term). As the yield curve steepens, this spread widens, potentially increasing bank profits.
In the bond market, a rising yield curve typically leads to a decline in bond prices because new bonds are issued with higher yields. This can be challenging for current bondholders as the value of their bonds decreases. However, it offers new investors an opportunity to purchase bonds at higher yields, which can be more attractive.
In the currency markets, a steepening yield curve, which often suggests robust economic conditions in the U.S., can attract foreign investment. This influx of capital strengthens the U.S. dollar as investors seek the higher returns associated with a strong economy.
Overall, the current movement towards a more positive slope in the yield curve reduces the perceived likelihood of an imminent recession. Although some might point to the fact that the 2008 financial crisis did not happen until the curve went back to normal again, it should be highlighted there were already significant warning signs beforehand.
In addition, as the yield curve returns to normal, It also indicates a potential shift in market focus from concerns about a recession to growth prospects. However, this change in market sentiment needs to be closely monitored, as disappointing earnings and a continuously sticky inflation rate can hamper any sign of a rate cut any time soon.
New ETF On The Block(chain)
The recent introduction of Ethereum ETFs on July 23, 2024, marks a significant milestone in the cryptocurrency market. These ETFs offer a wide array of investors the opportunity to gain exposure to Ethereum through traditional financial channels. Major financial firms such as BlackRock, Fidelity, VanEck, and Franklin Templeton have launched these ETFs, which are many of the same firms that launched Bitcoin ETFs.
Initial estimates suggest that Ethereum ETFs could attract inflows ranging from $4.8B to $6.4B in the first 100 days. While this is significantly lower than the $13.8B inflows observed with Bitcoin ETFs over a similar period, the disparity is due to Ethereum's smaller market capitalization—about one-third of Bitcoin's—and the fact that many institutional investors have already allocated funds to Bitcoin ETFs earlier in the year.
Despite these inflows, the market response has been relatively subdued. In the days following the ETF launches, the price of Ethereum remained stable at around $3,400. This stability could indicate that much of the positive news had already been priced into the market. Additionally, the lack of staking components in the ETFs, which would have allowed investors to earn returns by securing the Ethereum network, might have diminished some of the expected appeal.

Moreover, the introduction of Ethereum ETFs could influence future regulatory developments and pave the way for additional cryptocurrency-based ETFs. We first saw Bitcoin ETFs approved several months ago, and with Ethereum now being approved, it begs the question of whether Solana, Ripple, and other coins could be approved for something similar.
While the launch of Ethereum ETFs is a pivotal moment for the cryptocurrency market, its success and subsequent market impact will depend on several factors, including regulatory developments, investor adoption, and the broader economic environment. Market participants are closely watching this development, as it could set the tone for future cryptocurrency-based financial products.
Conclusion
Financial markets continue to present a complex landscape shaped by various macroeconomic and geopolitical factors. So far, the standout performance of SMH, compared to the similar trajectories of QQQ 0.00%↑ and IWM 0.00%↑ , underscores the unique challenges and opportunities within different sectors.
While the semiconductor industry has surged ahead, benefiting from technological advancements in AI and increased demand, the broader market, including tech and small-cap stocks, is experiencing a more turbulent path influenced by economic data, earnings reports, and global events.
The Federal Reserve's potential rate cuts, the evolving situation in China, and the introduction of Ethereum ETFs are critical elements that will likely shape the market's trajectory in the coming months across the markets. As we also saw volatility expand rather fast last week, we advise closely monitoring any potential re-expansion of said volatility to hedge your portfolio accordingly.
Curious to hear some of your thoughts below!