
Wild Week: What's Next?
Wild Week: What's Next?
The Unwinding Of The Yen Carry Trade

Introduction
Hi fellow investor/trader/warrior,
What a wild week it was. If you only opened your portfolio on Friday, you wouldn’t even have noticed that anything significant happened. Nonetheless, the fear in the market was big.
Yen Carry Trade
By now you will have heard about the issue. The Yen Carry Trade.
I won’t go into too much detail here as most of you know what I’m talking about, but basically what happened is the following:
Investors borrow cheap yen to invest in other currencies, which offer a higher yield. Others are even more ambitious and borrowed cheap Yen convert it into USD, MEX, EUR, or NZ and used these to invest in equities.
If used to simply invest in other currencies, this is a fairly low risk investment, but of course, this wouldn’t be the financial markets if there weren’t some market participants using massive leverage to amplify returns.
This has happened for years and is common practice. As such, there are a lot of market participants in this carry trade. Also, a lot of Japanese people actually do the carry trade themselves to make a small return on investment on their hard-earned money. An excellent example is the phenomen of the Mrs. Watanabe
You probably already notice where the issue lies? It works until it doesn’t
What happened next? The Bank of Japan (BOJ) raised its rates from 0% to 0.25%.
Yes, that’s it. An increase from 0% to 0.25% caused the market crash we saw earlier this week.As the interest rates rose, the Yen strenghtened, which caused other currencies to lose significant value against the Yen.
To pay these Yen loans back, these carry traders need to close their positions. This involved selling equities in international markets and close other currency positions.
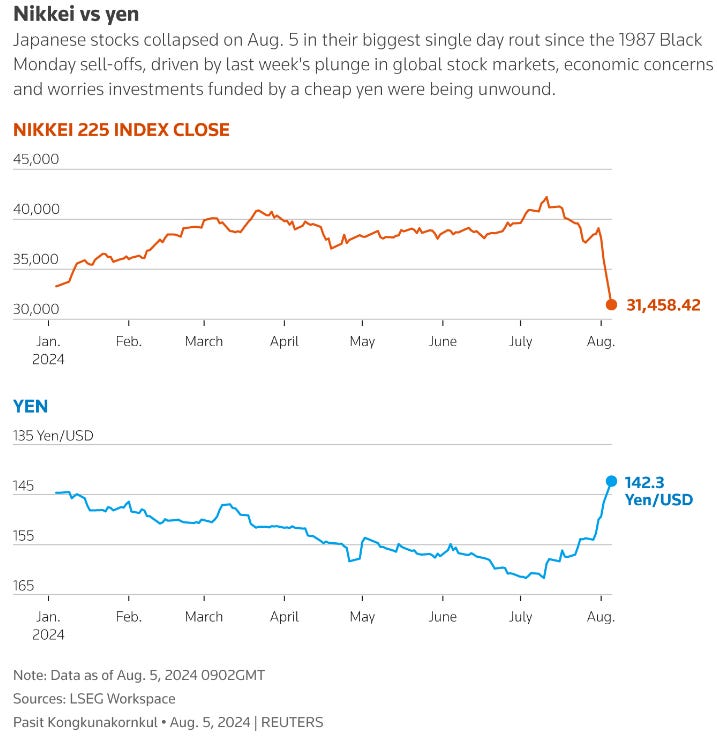
As followed, the Japanese stock exchange (NIKKEI) had its biggest sell-off since Black Monday (1987). Not only the Nikkei plummeted, but markets across the world fell
So that’s pretty much what happened, but now you might ask: “So how big was this issue and how many of these carry trades are still open?”
We don’t actually know. A UBS Japan macro strategist, James Malcolm, estimated around 50% of the carry trade has now unwounded. It is estimated that the carry trade was at least around $1 Trillion USD.
Are we completely out of the woods yet? No, there is still a lot of potential black swans out there. The situation in the Middle-East, Russia-Ukraine, elections,….
Look at the makets and act accordingly. Don’t be afraid to derisk a little if you see this going south again.
Now that we have seen this, let’s take a quick look at some charts.
Charts
S&P 500 & Nasdaq
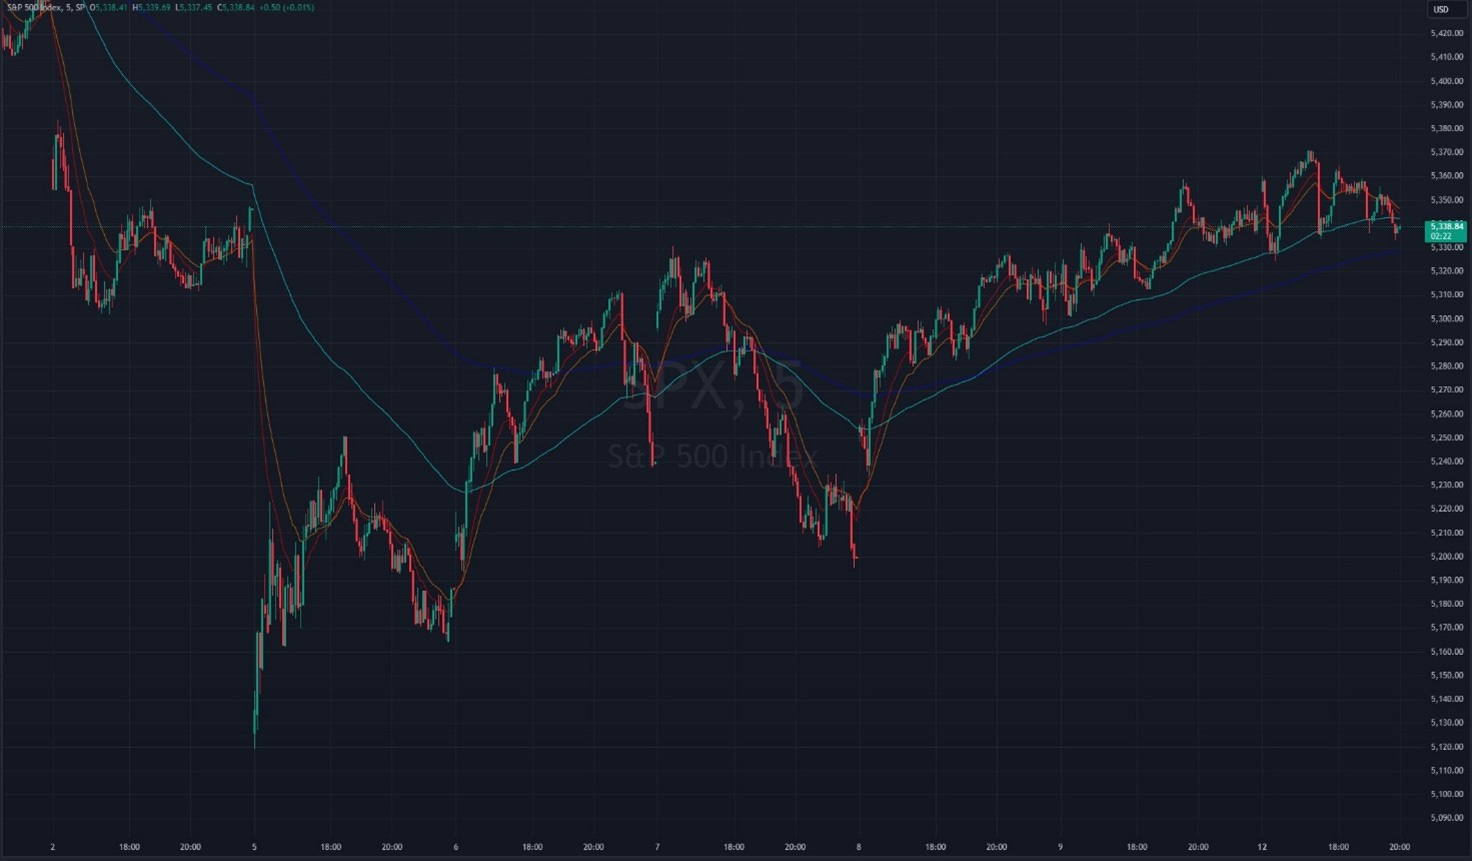
It was a volatile week with the $SPX hitting a low of 5,119.26 and reaching a high of 5,358.67. Eventually, the market closed at 5,244.15, up 4.39% of the week’s low.
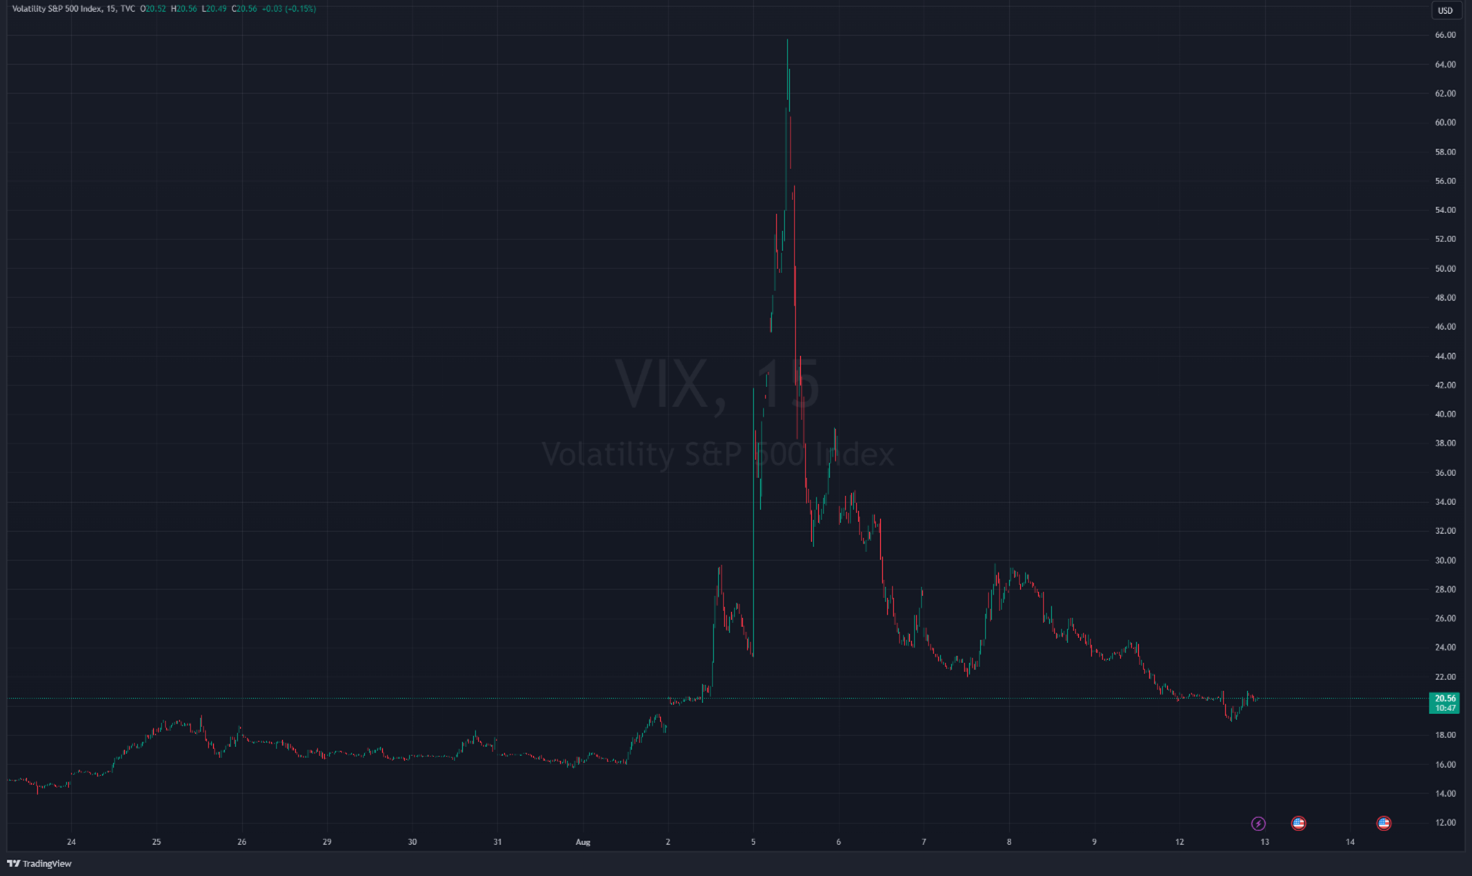
The VIX soared by more than 100% on Monday, August 5th, when the carry trade seemingly broke following the BOJ’s decision to raise interest rates to 0.25%. In fact, the VIX had already been creeping up since the beginning of August but was subsequently crushed following the spike on Monday, the fifth. It is important to note, however, that the VIX is still near 21, and therefore remains relatively high.
The drop in the SPX was something we hadn't seen in quite some time. The index opened 200 points lower than the close on the previous Monday but managed to regain some ground when the cash session opened. What makes this past week even crazier is that the index had essentially regained all the losses by Friday, the 9th.
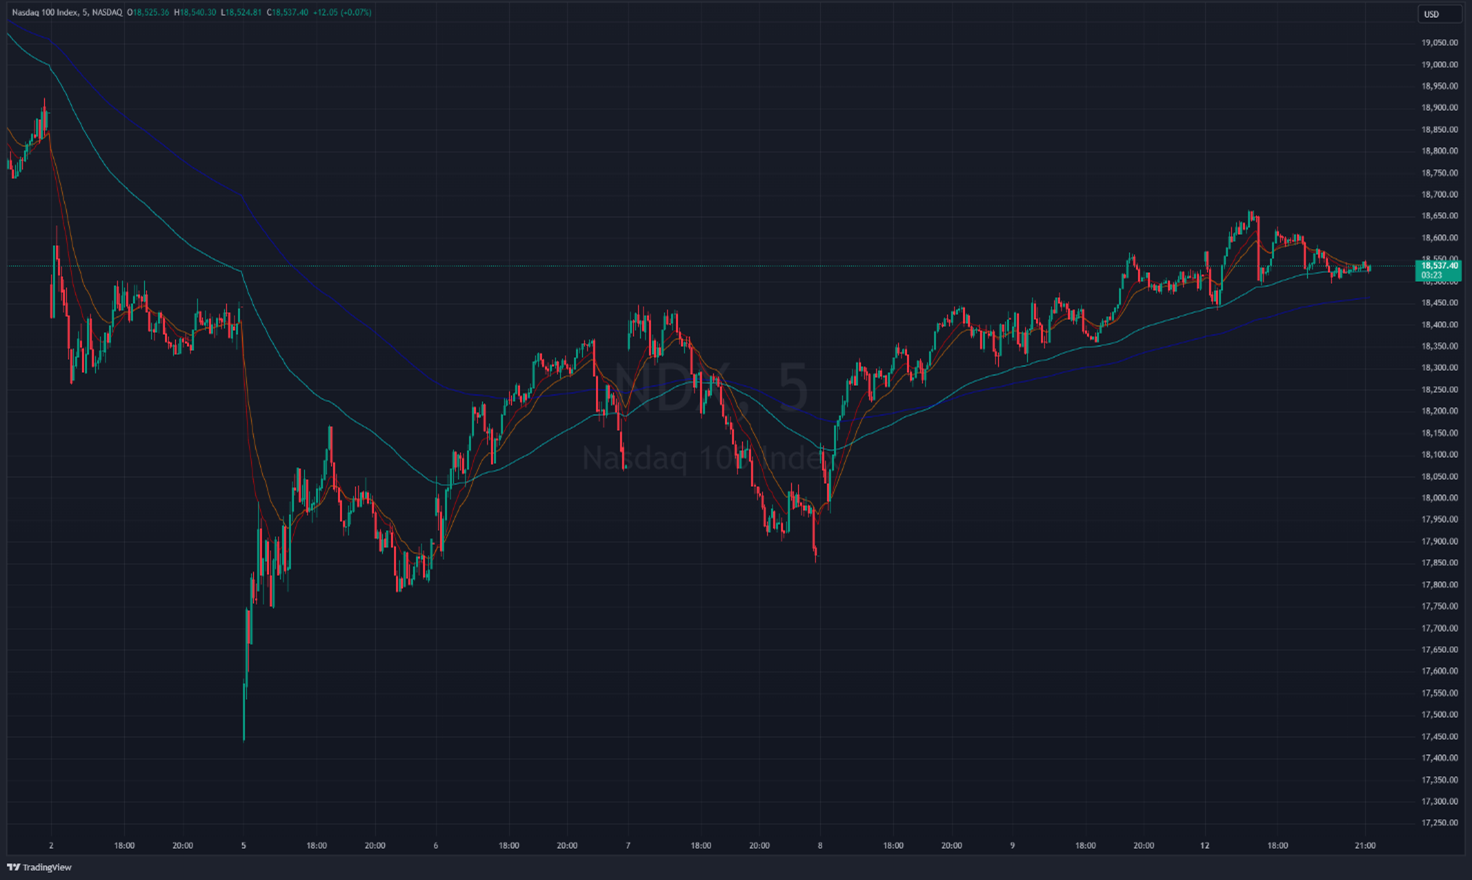
The picture is essentially identical when we look at the Nasdaq, which was down 6% during premarket trading but closed the day around 3% down.
USD/JPY and AUD/JPY
There were early warning signs when we looked at some of the most traded currency pairs on the market.
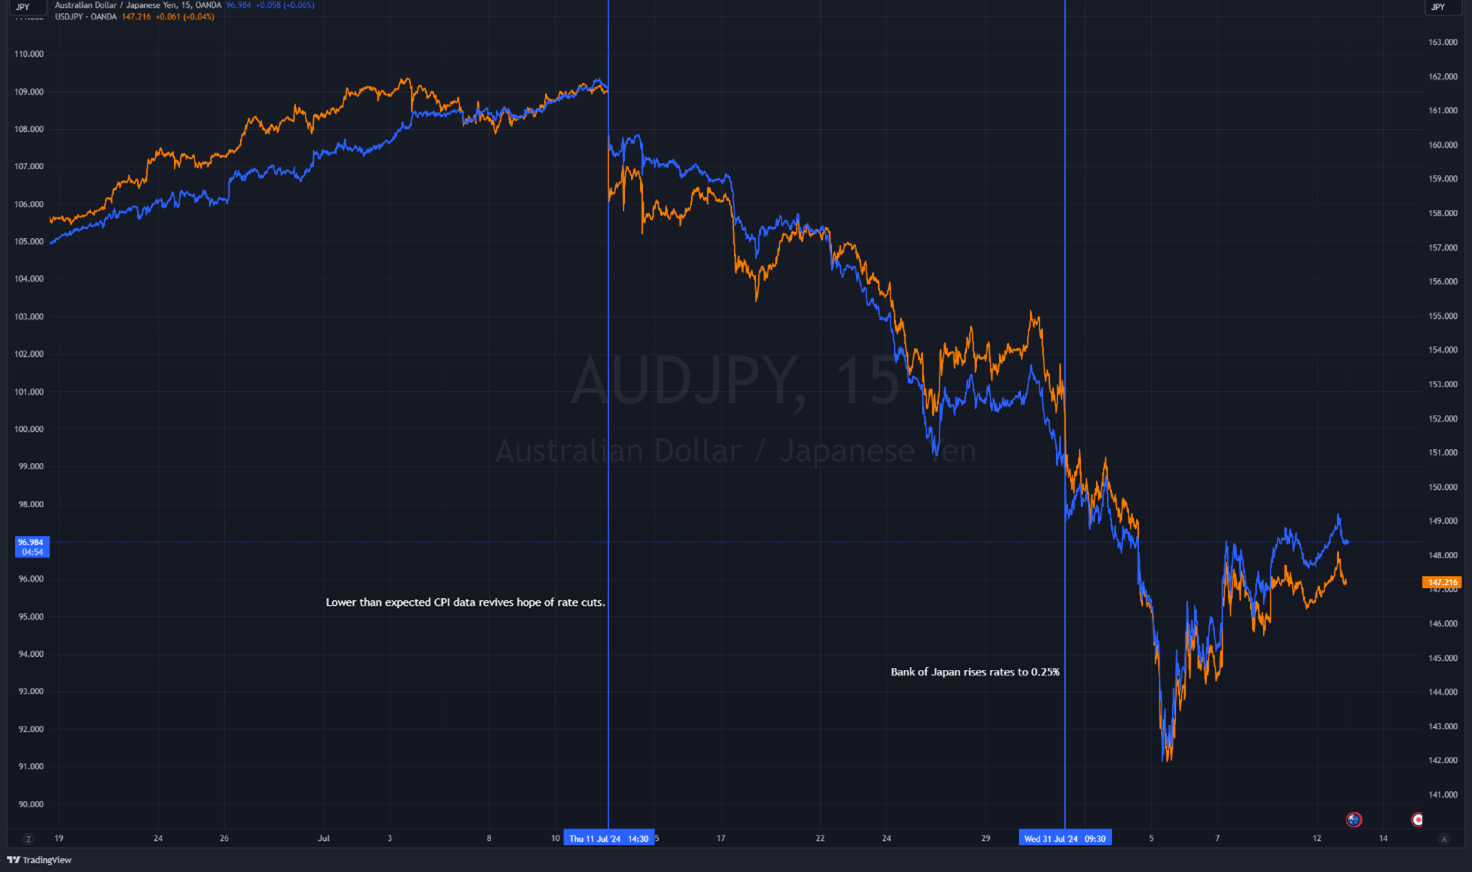
First, the AUD/JPY currency pair can be a great risk-off/risk-on indicator. This is mainly because the Australian dollar is highly correlated with the demand for commodities, as Australia is a major exporter of a wide range of commodities. Therefore, when the AUD/JPY pair is down, it indicates increasing demand for the Japanese yen (considered a safe haven, partially due to the carry trade mechanics), which can be interpreted as the market adopting a risk-off approach.
The picture is very similar when we look at the USD/JPY pair. The movement here can also be interpreted as a form of safe-haven demand. It is important to remember that lower-than-expected inflation data released on July 13th (inflation rate YoY came in at 3.0% vs. 3.1% expected) revived hopes of several rate cuts during the last months of 2024.
This, all else being equal, will weaken the dollar and, in turn, make the carry trade less profitable for investors. Additionally, the carry trade became less profitable when the BOJ raised rates, coinciding with a falling dollar.
Both pairs seem to have hit a temporary bottom, along with the SPX and NDX, as the market is currently looking to take on more risk. This shift is especially highlighted by the AUD/JPY pair, which is up almost 6 points since August 5th.
AUDJPY (blue) and USDJPY (orange)
Conclusion
That was it for this week. If you enjoyed this post consider subscribing.
Did you make any panic moves this week or did you buy the dip? let us know!