
The Markets Never Rest.

Introduction
Hi Friends,
The markets truly never rest, and we’ve had several eventful trading days following the intense volatility on August 5th. This shake-up ended up providing a great opportunity to buy the dip, allowing us to nearly erase the losses from a few weeks ago.
After events like the yen-carry trade bonanza, which we discussed in the post below, it’s always a good idea to take a step back and assess the overall market sentiment.

This can be easily done with just a few charts. Below, we have a chart showing Invesco’s Equal-Weight S&P 500 ETF (RSP) and the spread between iShares’ investment-grade corporate bonds and their high-yield corporate bond ETFs.
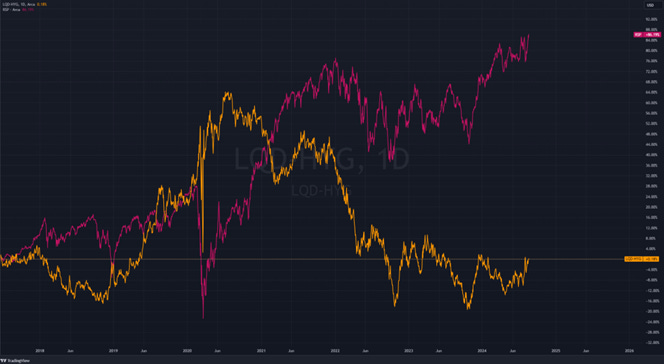
As you can see, the RSP hit a new all-time high a few days ago, indicating that it's not just a select few big-cap stocks (like Nvidia) that are getting attention; in fact, a good number of stocks are starting to gain favor in the market. Additionally, the spread between investment-grade corporate bonds and high-yield corporate bonds is relatively small, suggesting there is no significant stress in this spread—and by extension, no real stress in the market at the moment.
With the market still somewhat in summer mode, and things likely to heat up next week as we approach September, our focus should be on the market's anticipation of the first rate cuts and what the forex market is telling us about overall concerns and stress.
When will we see the first rate cut?
The question of when the Fed will initiate its first rate cuts has been a hot topic for nearly two years, and it seems we're finally approaching a point where the Fed might feel comfortable lowering interest rates.
Fed Chair Jerome Powell has repeatedly emphasized that the Fed’s primary mandates are to keep inflation around the 2% target and stabilize the labor market. Recently, we’ve seen a notable increase in the unemployment rate to 4.3%, which could be a key factor in the Fed's decision-making process.
Looking at the three-month SOFR (Secured Overnight Financing Rate) futures, these contracts provide a glimpse into how the market is predicting the path of short-term interest rates. They offer insight into how traders and investors expect the Federal Reserve to act in the coming years.
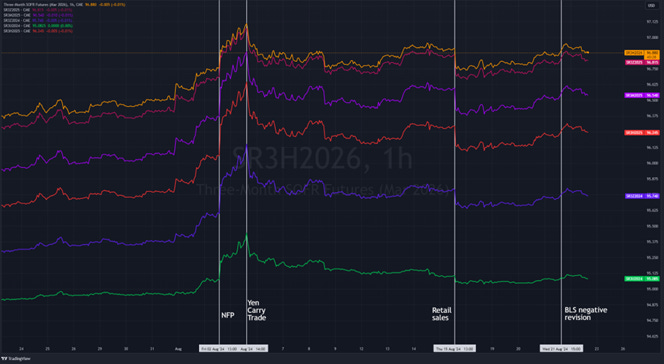
Right now, the market is betting that the Fed will start cutting interest rates in September 2024, with a 25 basis point reduction being the most likely scenario. This suggests that after a period of tightening, the Fed might begin to loosen its policy to support the economy. The futures prices for this period reflect a high level of confidence in this timing, which is a key indicator of how the financial community views the economic outlook.
Looking ahead to March 2026, these futures indicate that interest rates could settle around 3.2%. This projection comes from the price of the SR3H2026 contract, which suggests an expected rate of about 3.12%.
The movement of these futures is closely tied to economic data and global financial events. Significant shifts often occur after key moments, such as the release of Non-Farm Payrolls (NFP) data, changes in the Yen carry trade, retail sales reports, and revisions from the Bureau of Labor Statistics (BLS).
Each of these events can influence the market’s expectations about the economy’s future and, consequently, the Fed's actions.
In summary, the market is preparing for a rate cut in September 2024, with interest rates expected to be around 3.2% by March 2026. This outlook reflects a cautious approach, anticipating a gradual easing of rates over the next few years. The chart highlights how sensitive these expectations are to new information, with each economic event potentially altering the market's view on interest rates. It’s a reminder of how interconnected the world of finance is, where even small data points can significantly impact market sentiment.
At the same time, the market is still favoring 10-year bonds over 2-year bonds, as the yield curve remains inverted. The chart below specifically tracks the spread between these two yields. Normally, longer-term bonds like the 10-year should yield more than shorter-term ones like the 2-year. However, when this spread turns negative, resulting in what's known as a yield curve inversion, it’s often seen as a warning sign of an impending economic slowdown or recession.
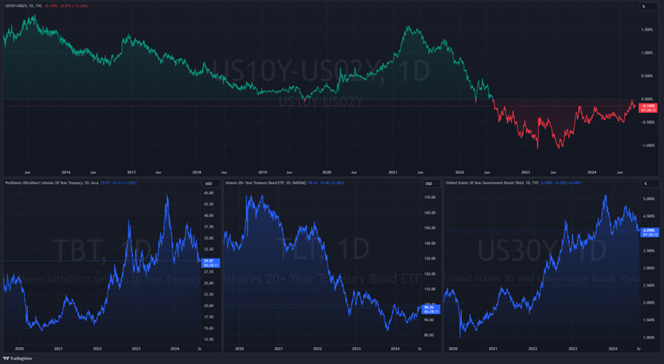
The chart above shows that the spread between the 10-year and 2-year Treasury yields has been negative since mid-2021. This inversion primarily indicates that the market has been concerned about future economic prospects, expecting slower growth or even a potential recession.
Recently, however, the inversion has started to narrow, and it even briefly turned positive for a few minutes on August 5th. This could be a sign that the market is beginning to believe the Federal Reserve might soon pivot away from its current policy of raising interest rates, a shift that is also reflected in the SOFR futures.
Overall, the yield curve is a crucial indicator for gauging economic health. The prolonged inversion we see in the chart highlights ongoing concerns about the economy, but the slight narrowing could suggest that a shift in monetary policy might be on the horizon, potentially alleviating some of these worries. This dynamic underscores how essential the yield curve is in predicting economic cycles and guiding investor expectations, making it something we must monitor closely as we approach the next Fed meeting.
The Forex Market
Not much has been happening in the forex market since our last article on Substack, and we’re actually seeing a return to normality after the turbulence of July and early August.
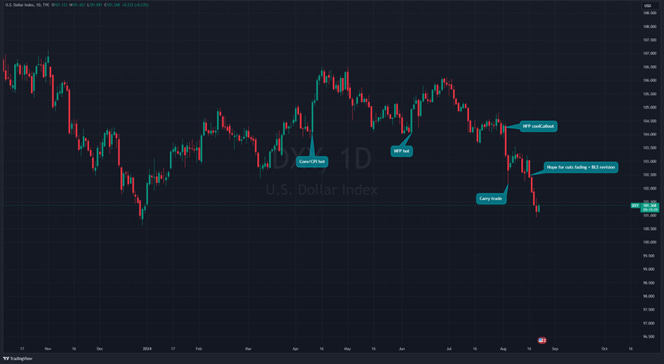
If we look at the DXY, which serves as a proxy for the overall strength of the U.S. dollar, we can see that it has been falling as hopes for interest rate cuts have increased. This decline makes perfect sense and shouldn’t be viewed as a cause for concern. In fact, it’s a positive sign, especially considering that inflation has been steadily decreasing while unemployment has now become a more pressing issue for the Fed.
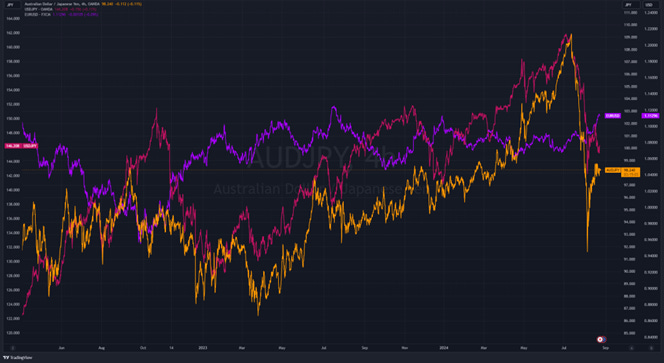
Lastly, we discussed the implications of the AUD/JPY and USD/JPY currency pairs in our last article, so let's take a look at how these pairs are performing now. Following a sharp rise and then a sharp decline in both the AUD/JPY and USD/JPY pairs, we’re now almost back to their average trajectories. What does this mean? It suggests that the market isn’t particularly concerned about any major issues at the moment, and all attention is focused on the Fed’s upcoming September meeting.
Conclusion
To summarize it all, the market's recent behavior basically highlights a cautious yet optimistic outlook as we approach the Fed's anticipated rate cuts, expected to begin in September 2024. While the yield curve inversion still reflects concerns about an economic slowdown, the narrowing of this spread suggests that a shift in monetary policy may be on the horizon, potentially easing these worries.
The forex market, too, has stabilized after a period of turbulence, with attention now firmly on the Fed’s upcoming decisions. Overall, the correlation of all these indicators only shows the importance of keeping a close eye on how they develop as we approach September.
In addition, the market rallies significantly after the initial sell-off after the unwind of the Yen carry trade. As such, stay careful out there and follow what the markets give to you.
Happy Trading and Investing!