

State of The Market
18th of April 2024

Turmoil
As there is currently quite a lot of things happening in the market I thought it would be interesting to share this short post with you in which we take a quick look at some charts and see where the S&P 500 and Bitcoin are currently at. Next week, we will take a deeper look at Gold, USD, and more!
Before we start, make sure to subscribe by clicking on the button below. That way, you make sure you won’t miss an article like this next time!

Interesting News and Charts
As you might be aware large caps massively outperformed compared to small caps over the last 3 years. When we take a look at the S&P 500 ETF SPY 0.00%↑ , which represents the US large caps, versus the Russell 2000 ETF, representing the US small caps IWM 0.00%↑ , we can see a clear winner.
As you can see, SPY returned 26.83% over the last 3 years compared to the dreadful return of IWM, which had a negative 9.20% return over that same time period.
Will small caps start outperforming soon? Let us know what you think.

Delinquency Rates Highest since 2011
one of my favorite accounts to follow for financial news is Charlie Bilello. Mr. Bilello posted the following chart earlier this week showing US credit card delinquencies. US Credit card delinquencies rose to 3.2% in Q4 of 2023, they are now at the highest level since 2011.
Will they spike up to 6%+ in the next few years like we saw in 2008-2009?

Some Analysis
Currently, the market is having a pretty rough month with the S&P 500 ETF down over 3.50% and the IWM doing even worse as it is down over 6.50%.

Increasing tension in the Middle-East combined with hotter than expected inflation numbers didn’t help the market. Let’s hope we don’t see any further escalation in the Middle-East, as this could have an impact on multiple goods further fueling potential inflation.
In addition, oil prices are a must watch as approximately 20% of seaborne oil in the world is transported via the Strait of Hormuz, which is where the Portuguese ship that reportedly had ties with Israel was seized by Iran’s Revolutionary Guard.
If you like it so far, I would appreciate it if you could share it with your friends!
Charts, Charts, Charts!
In this paragraph we will dive a bit deeper into the technical analysis of the SPY, Bitcoin, Gold, and a surprise stock at the end!
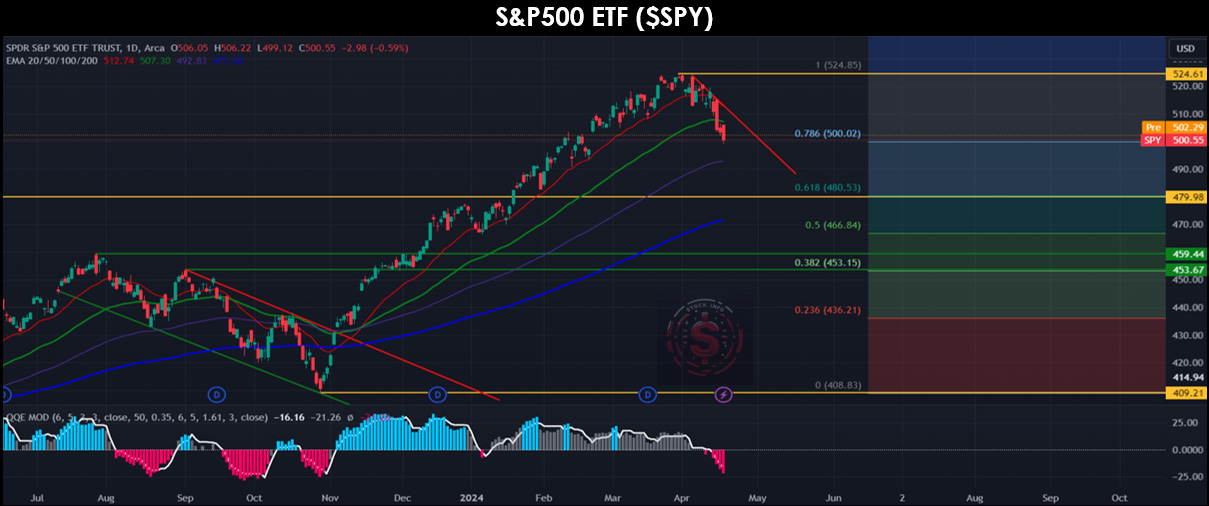
Let’s start with $SPY, which has experienced a notable decline of over 4.50% from its all-time high reached just two weeks ago. As of our latest data, the SPY sits at 500.55 points, down from 515.30 at the beginning of the week, reflecting the recent downward momentum in the market.
A crucial aspect to consider in our analysis is the positioning of the exponential moving averages (EMAs). Currently, the SPY is trading below its 20-day and 50-day EMAs, indicating short-term weakness. However, it's noteworthy that the index remains above its 100-day and 200-day EMAs, suggesting that the long-term bullish trend is still intact.
Despite the recent pullback, it's important to maintain perspective. The SPY is still up over 6% since the beginning of the year, underscoring the resilience of the broader market amidst various challenges.
One significant technical observation is the proximity of the market to an important Fibonacci support level. Fibonacci retracement levels are widely followed by traders and investors, and a breach of this level could signal further downside pressure. Should the market fail to hold this Fibonacci level, we may see a downward movement towards the 480.53 level, which aligns with the next Fibonacci level and coincides with the previous all-time high of late 2021, early 2022 (golden support line).
Moreover, geopolitical tensions in the Middle East, particularly the evolving conflict between Iran and Israel, are emerging as a crucial catalyst for market sentiment. Investors are closely monitoring developments in the region as they could have significant implications for global stability and economic dynamics.
In terms of potential positive price action, it's imperative for the market to find support at the current Fibonacci level. A bounce from this level would instill confidence among investors, with a key milestone being the reclaiming of the 50-day EMA. Reestablishing above this moving average would signal a potential shift in momentum towards the upside.
Stay tuned for further updates as we navigate through these challenging, yet opportunistic times.
For a larger macroeconomic outlook I highly recommend you to check out our latest article, where we go more in-depth on economic indicators, China, and the conflict in the Middle-East.
Now let’s take a look at Bitcoin!
Bitcoin has experienced a significant decline of over 15% since reaching its all-time high of $73,794 just over a month ago. As of our latest data, Bitcoin is trading at a level reminiscent of the lows observed last month, suggesting a period of consolidation following the recent volatility.
Similar to the SPY, Bitcoin has fallen below its 20-day and 50-day exponential moving averages (EMAs), indicating short-term weakness in price momentum. However, it's noteworthy that the cryptocurrency is still holding above its 100-day and 200-day EMAs, underscoring the resilience of the long-term bullish trend.
Despite the recent pullback, Bitcoin remains up over 47.50% since the beginning of the year, reflecting the overall positive sentiment among investors. However, anticipation of the upcoming halving event has led to some selling pressure, as traders engage in profit-taking ahead of the anticipated "sell the news" event.
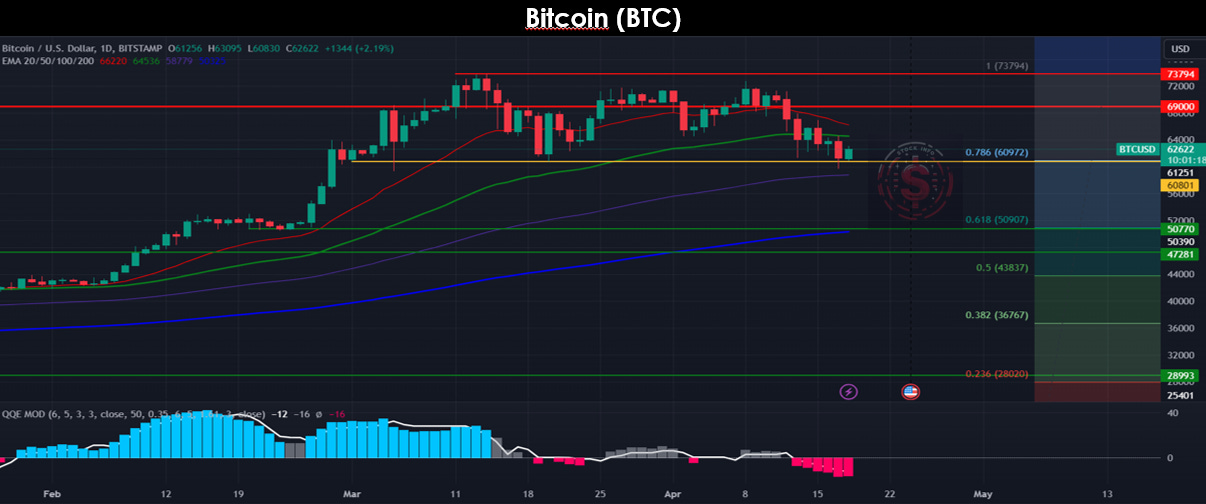
Geopolitical news has also contributed to the recent price fluctuations in Bitcoin. However, from a technical standpoint, the cryptocurrency is still displaying favorable signs, particularly if it manages to find support at the current level. This support zone coincides with a Fibonacci level, adding further significance to its importance.
Should Bitcoin fail to hold this support level at $60,972, the next Fibonacci level at $50.9k becomes a critical level to monitor. A breach of this level would open the door to additional downside potential, highlighting the importance of maintaining a cautious stance amidst the current market conditions.
Looking ahead, it's crucial to keep a close eye on both the current all-time high and the previous cycle's all-time high. These levels serve as key reference points for assessing Bitcoin's price action and determining potential areas of resistance on the upside.
That was it for today’s write-up. If you enjoyed it, consider leaving a like and subscribing so you don’t miss out on any future posts. This motivates us to keep sending these out for free. In addition, sharing this write-up with your friends would be greatly appreciated.
If you want to reach out to me directly feel free to send me a DM on X!