
Price Discussion and Option Chain Analysis CCJ, PYPL, and BABA
Price Discussion and Option Chain Analysis CCJ, PYPL, and BABA

Introduction
Welcome back, dear readers!
I've been dedicating some time to growing my subscriber base on Seeking Alpha and X, but I'm thrilled to be back on Substack with some exciting news to share shortly.
Now, let's dive into the good stuff!
After an eventful week, especially with the monthly option expiration behind us, we're eager to explore how the option chain has evolved for the upcoming month.
Join us as we uncover the key call and put walls for the October 20 expiry date."
Cameco Corporation (CCJ)
What an incredible month it has been for Cameco! With an impressive 18.32% surge, this uranium heavyweight has been riding the wave of momentum in the uranium market. Just today, Cameco's stock price soared past the $40 mark, reaching levels we haven't witnessed since 2011.
But before we dive deeper into our option chain analysis, let's first take a moment to appreciate the chart. Cameco holds a pivotal position in the uranium market, often considered the barometer of sentiment in the sector.
As depicted in the chart below, CCJ is currently entrenched in a robust uptrend, boldly breaching the $40 threshold today. However, looming ahead is the formidable 2011 peak (marked by the golden line), which stands as a critical resistance point. Should the stock conquer this level, it might pave the way for revisiting all-time highs, a territory untouched since 2007.
As we navigate this exciting terrain, keep a keen eye on the crucial support level at approximately $32.50, a potential stronghold for CCJ.

Option Chain Analysis: MMEM and Open Interest
Now, let's dive into what you're really here for – the option chain analysis.
MMEM
At present, the Market Maker Expected Move (MMEM) for the October 20, 2023 strike on CCJ ranges from $3.44 to $3.55. In essence, this indicates that market makers anticipate CCJ to trade within the range of $36.75 to $43.85 by October 20th. This projection suggests an approximate 9% price movement, as envisioned by market makers.
If you foresee a substantial deviation below or above these thresholds, you might find the purchase of a straddle appealing, enabling you to profit from heightened volatility. Conversely, if you believe Cameco stock will remain within the $36.75 to $43.85 per share range on October 20th, selling a short straddle could be an intriguing strategy.
Open Interest: Call and Put Walls
Examining open interest can unveil the zones where a stock's maximum pain point resides. In theory, this 'max pain' level is ideal for market makers since it corresponds to the point where most options expire worthless, maximizing profits for market makers.
As illustrated in the chart below, there's a substantial amount of open interest on both the $35 and $40 calls for the January 2024 expiry. Consequently, we observe that call option open interest significantly outweighs put option open interest.
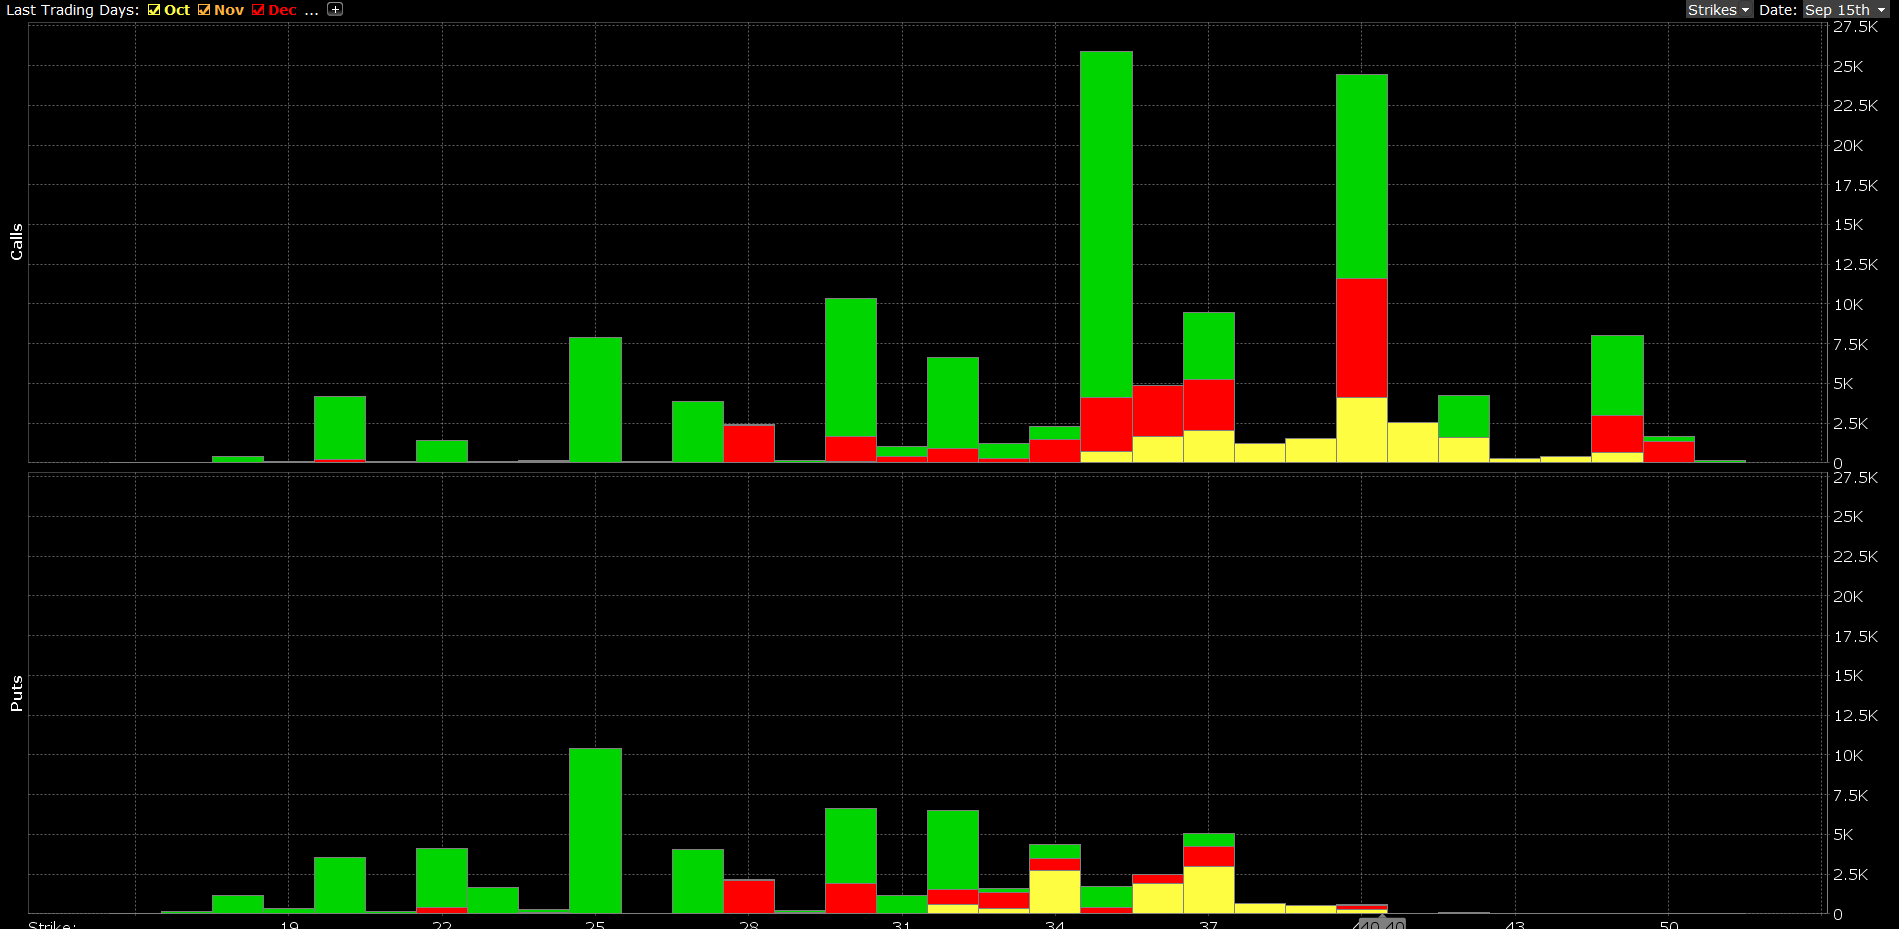
Shifting our focus to the October 20th expiration, a similar pattern emerges. There is notable open interest in the $40 calls, yet it's evident that investors have shifted their puts toward the $34, $36, and $37 strikes.
Currently, it appears that the maximum pain point for the October 20th expiration lies around the $37 strike. This scenario would result in the majority of options expiring worthless, representing the most profitable outcome for market makers.
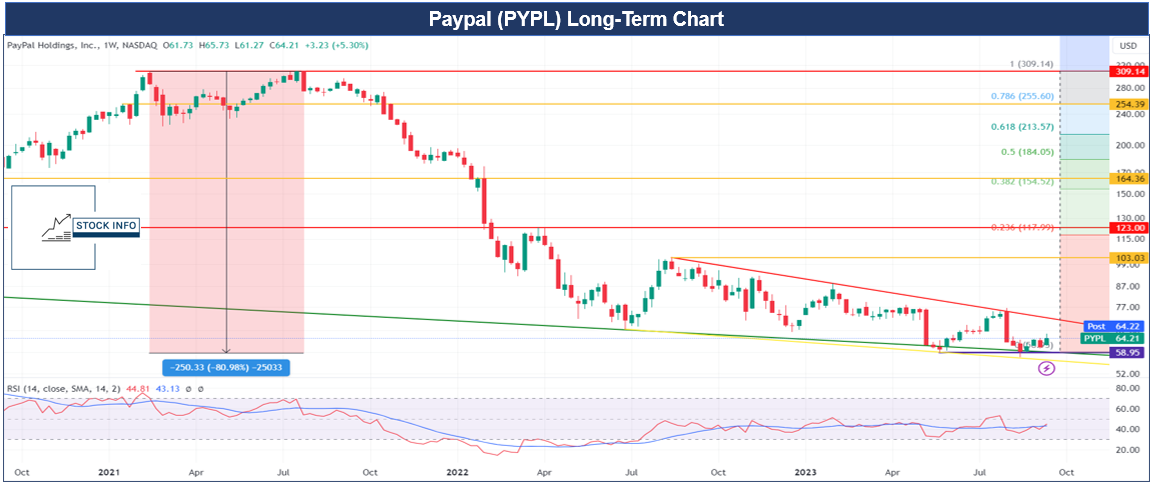
Paypal (PYPL): A Polarizing Outlook
PayPal, a company that sparks diverse opinions among investors. Bulls see the potential for it to soar past $100 within the next two years, while bears proclaim its downfall.
On August 7th, I outlined my current Paypal trade in this post on X (formerly Twitter). in a post on X (formerly Twitter). It involves a small LEAPS position that could yield returns exceeding 100x if everything aligns perfectly. However, that's not the primary goal for such trades. In my view, the risk/reward ratio at the time of writing, and even now, remains highly attractive.
I won't delve too deeply into the current technical analysis (TA) as it largely speaks for itself. This week, we conducted a brief TA video on PYPL on Instagram, which can be found here.
Crucially, the vital support level has held since then, and there are even slight indications of a potential upswing within the current range.
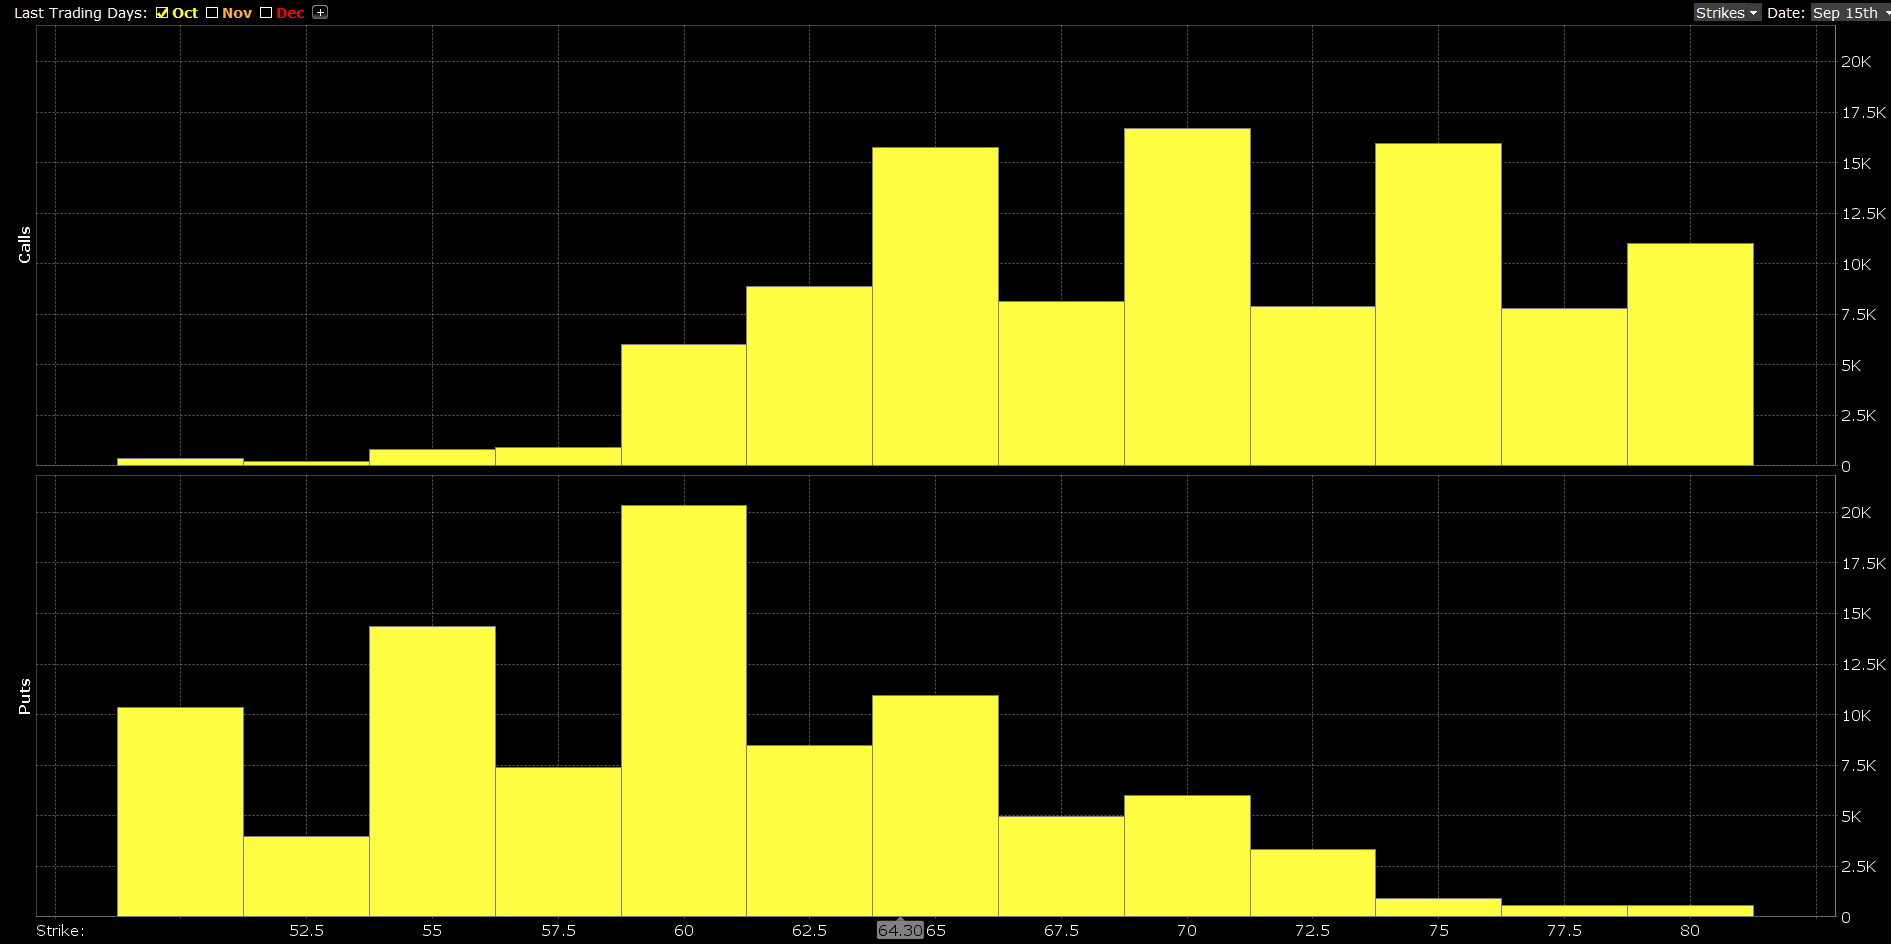
Option Chain Analysis: MMEM and Open Interest
MMEM
At present, the Market Maker Expected Move (MMEM) for the October 20, 2023 strike on PYPL ranges from $4.38 to $4.54. This implies that market makers anticipate PYPL to trade between $59.71 and $68.79 by October 20th. This projection suggests an approximately 7% price movement, as foreseen by market makers.
If you anticipate a significant deviation below or above these levels, consider acquiring a straddle to leverage the heightened volatility. Conversely, if you believe that Paypal stock will experience a price fluctuation of less than 7% per share by October 20th, selling a short straddle might be enticing.
Open Interest: Call and Put Walls
As you can see in the chart below, the option chain analysis for PYPL is a bit more complicated compared to CCJ.
Notably, there's substantial open interest in the $60 puts and the $70 and $80 calls at the time of writing. Even the $90 and $95 calls for the January 2024 expiration show considerable open interest.
When scrutinizing the January 2024 expiry, we observe significant open interest in both the $35 and $40 calls. As mentioned earlier, it's apparent from the open interest data that PYPL exhibits more diverse sentiment compared to CCJ.
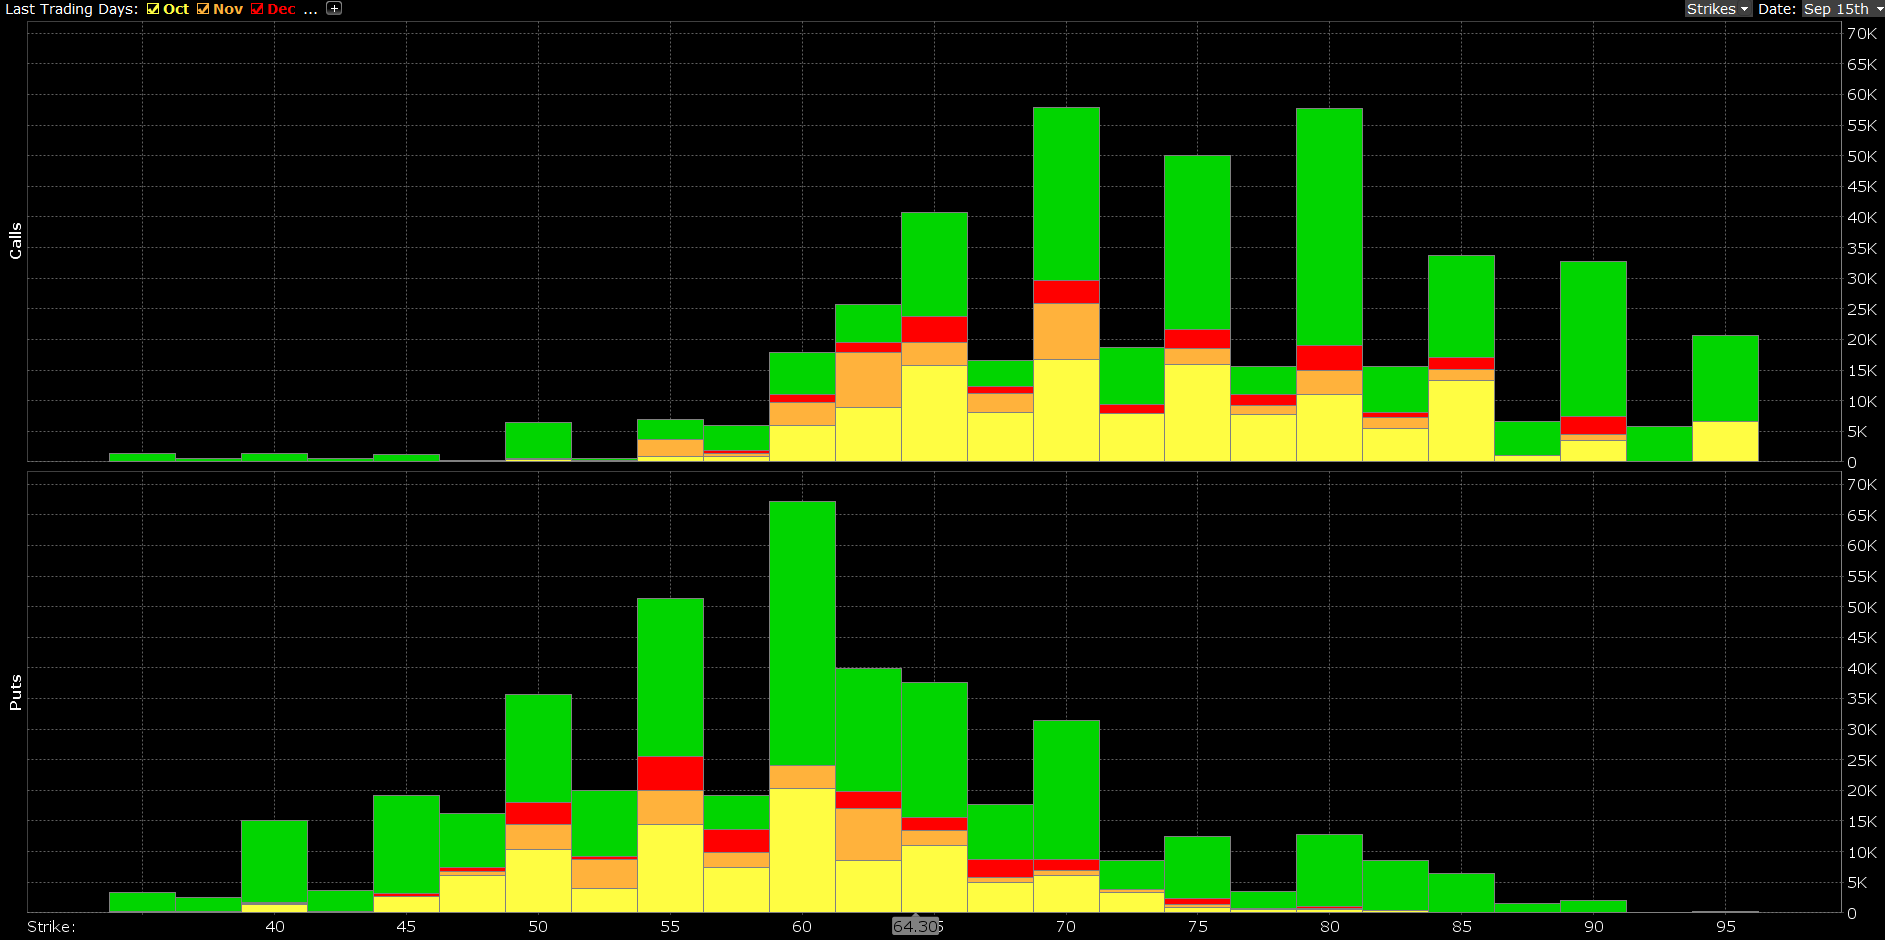
Turning our attention to the October 20th expiration, a similar trend emerges. The $60 puts have massive open interest, while the $65, $70, and $75 calls display significant open interest.
Presently, it seems that the maximum pain point for the October 20th expiration centers around the $65 strike. This outcome would render most option contracts worthless, representing the most favorable scenario for market makers.
In this scenario, all contracts from the $65 call strikes and above would expire worthless, as would most of the puts. The current stock price of $64.30 aligns quite well with the market makers' objectives for October 20th.
Alibaba (BABA)
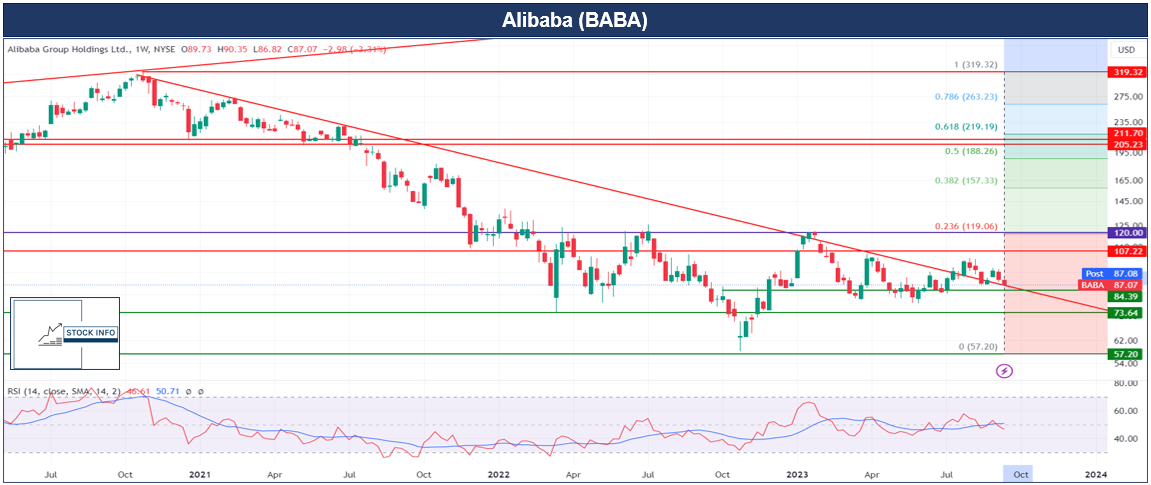
Alibaba, the eminent Chinese conglomerate, commands unwavering attention. With China's market outlook growing increasingly uncertain, a palpable sense of apprehension has permeated the investment landscape.
Consequently, BABA has witnessed a decline of 4.87% in the past month, notably underperforming the SPY, which has remained largely stagnant over the same period.
Presently, BABA is trading below all of its weekly moving averages. However, amidst this descent, a glimmer of hope emerges as the stock retraces to test the red-trendline support. This support, previously a formidable resistance, was breached at the close of July.
Of particular significance is the $120 level, as it stands as a critical juncture amid the looming resistances. This level is in close proximity to a Fibonacci level, adding to its significance. Thus, it assumes the mantle of utmost importance for bullish prospects. Conversely, vigilance is warranted on the downside, with the $84 support level serving as a pivotal marker. A breach of this level could potentially usher in a descent toward the $73-$74 zone.
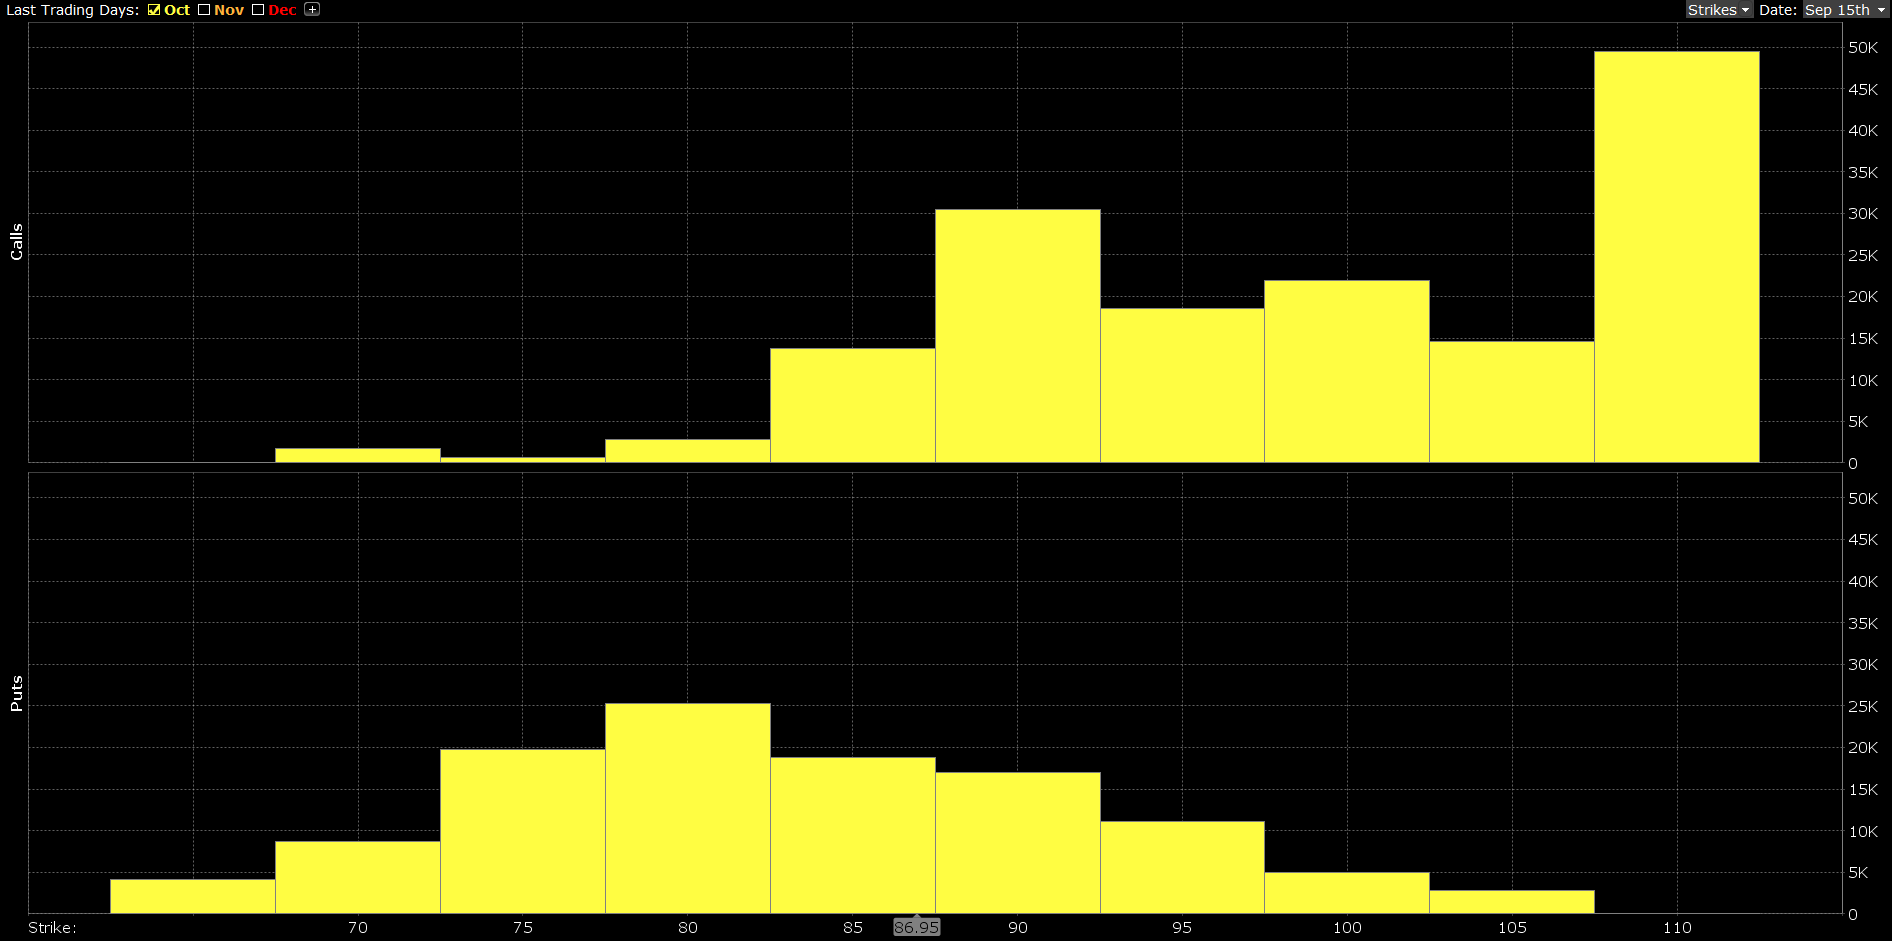
Option Chain Analysis: MMEM and Open Interest
MMEM
The October 20, 2023 strike for BABA currently holds an intriguing outlook. The Market Maker Expected Move (MMEM) stands at a range of $7.36 to $7.55. In essence, this implies that market makers anticipate Alibaba to trade within the confines of $79.52 to $94.62 by October 20, 2023.
This projection suggests a potential movement of approximately 9%, offering both opportunities and challenges for traders.
Open Interest: Call and Put Walls
Alibaba's option chain reveals a distinctive pattern. Put options exhibit a typical distribution, with a notable concentration of open interest hovering around the $80 strike.
On the other hand, the call side presents a different narrative. Substantial open interest is evident at multiple strikes, including $100, $110, $120, and $130. This configuration sparks curiosity regarding the evolving distribution of call and put options in the months ahead.
It will be interesting to see how the call and put distribution will evolve in the upcoming months towards year end.
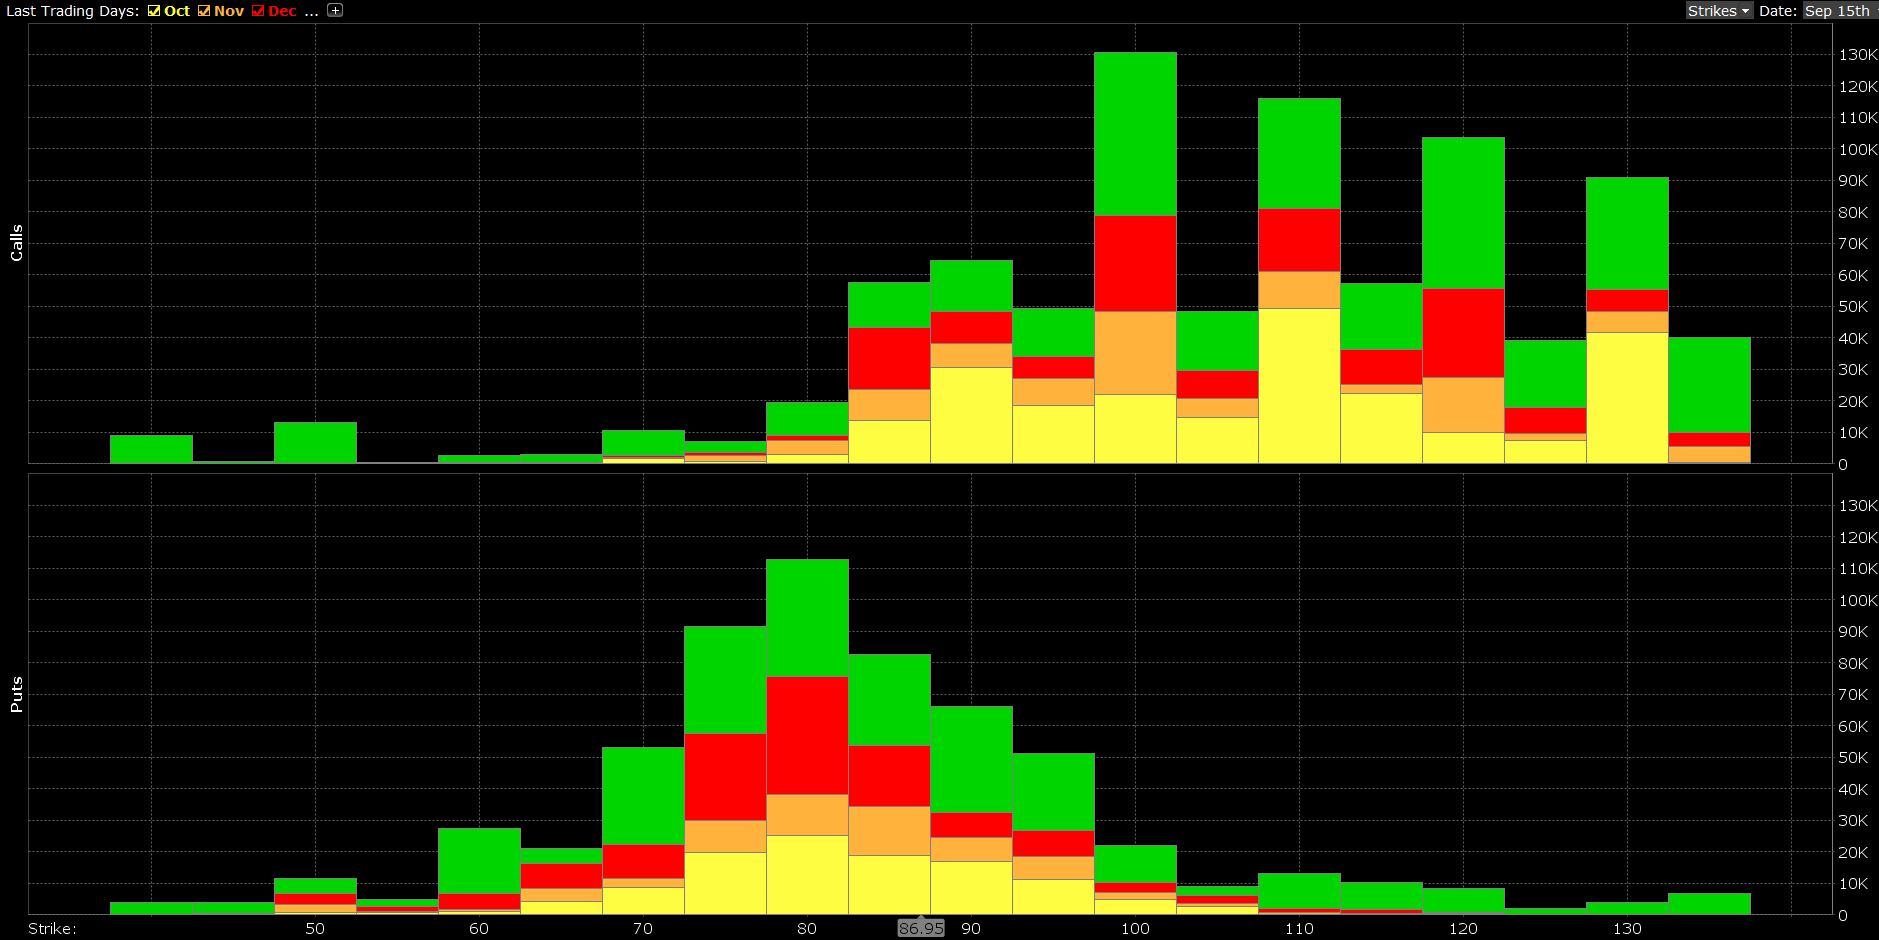
For the bullish contingent, the current scenario appears less favorable. The preponderance of put options below the $90 strike, contrasted with the majority of calls above $90, hints at a probable endeavor by market makers to maintain BABA's stock price below $90 at expiration.
Furthermore, the colossal open interest in the $110 call options is particularly intriguing. Given the significant likelihood of these contracts expiring worthless, it is highly probable that they will be rolled over in the near future.
If you want to learn more about the fundamentals of Alibaba, feel free to read our articles on the company by clicking HERE and HERE.
Conlusion
Thank you for delving into this post, where we've delved into the worlds of CCJ, PYPL, and BABA. Stay tuned for next month's follow-up, where we'll dissect any noteworthy developments and examine the evolving landscape of max pain. If you have specific stocks in mind that you'd like me to analyze, please don't hesitate to share your requests.
Exciting news is on the horizon! I'm thrilled to announce a major project that's currently in the works for this Substack community. Stay tuned for forthcoming details about this exciting venture.
To ensure you don't miss the unveiling of my new project, be sure to follow us. As always, your support through likes and shares of this post is greatly appreciated. Enjoy your weekend!