
Chart Ideas

Introduction
Hi everyone, in this new segment we will take a look at some interesting charts, which you can use as you like. In this article, we have 4 charts ready for you with some commentary!
So without further ado, let’s get started!
To receive more insightful posts like these completely for free, make sure to subscribe by clicking the button below.
Bitcoin $BTC (Weekly Bull Flag)
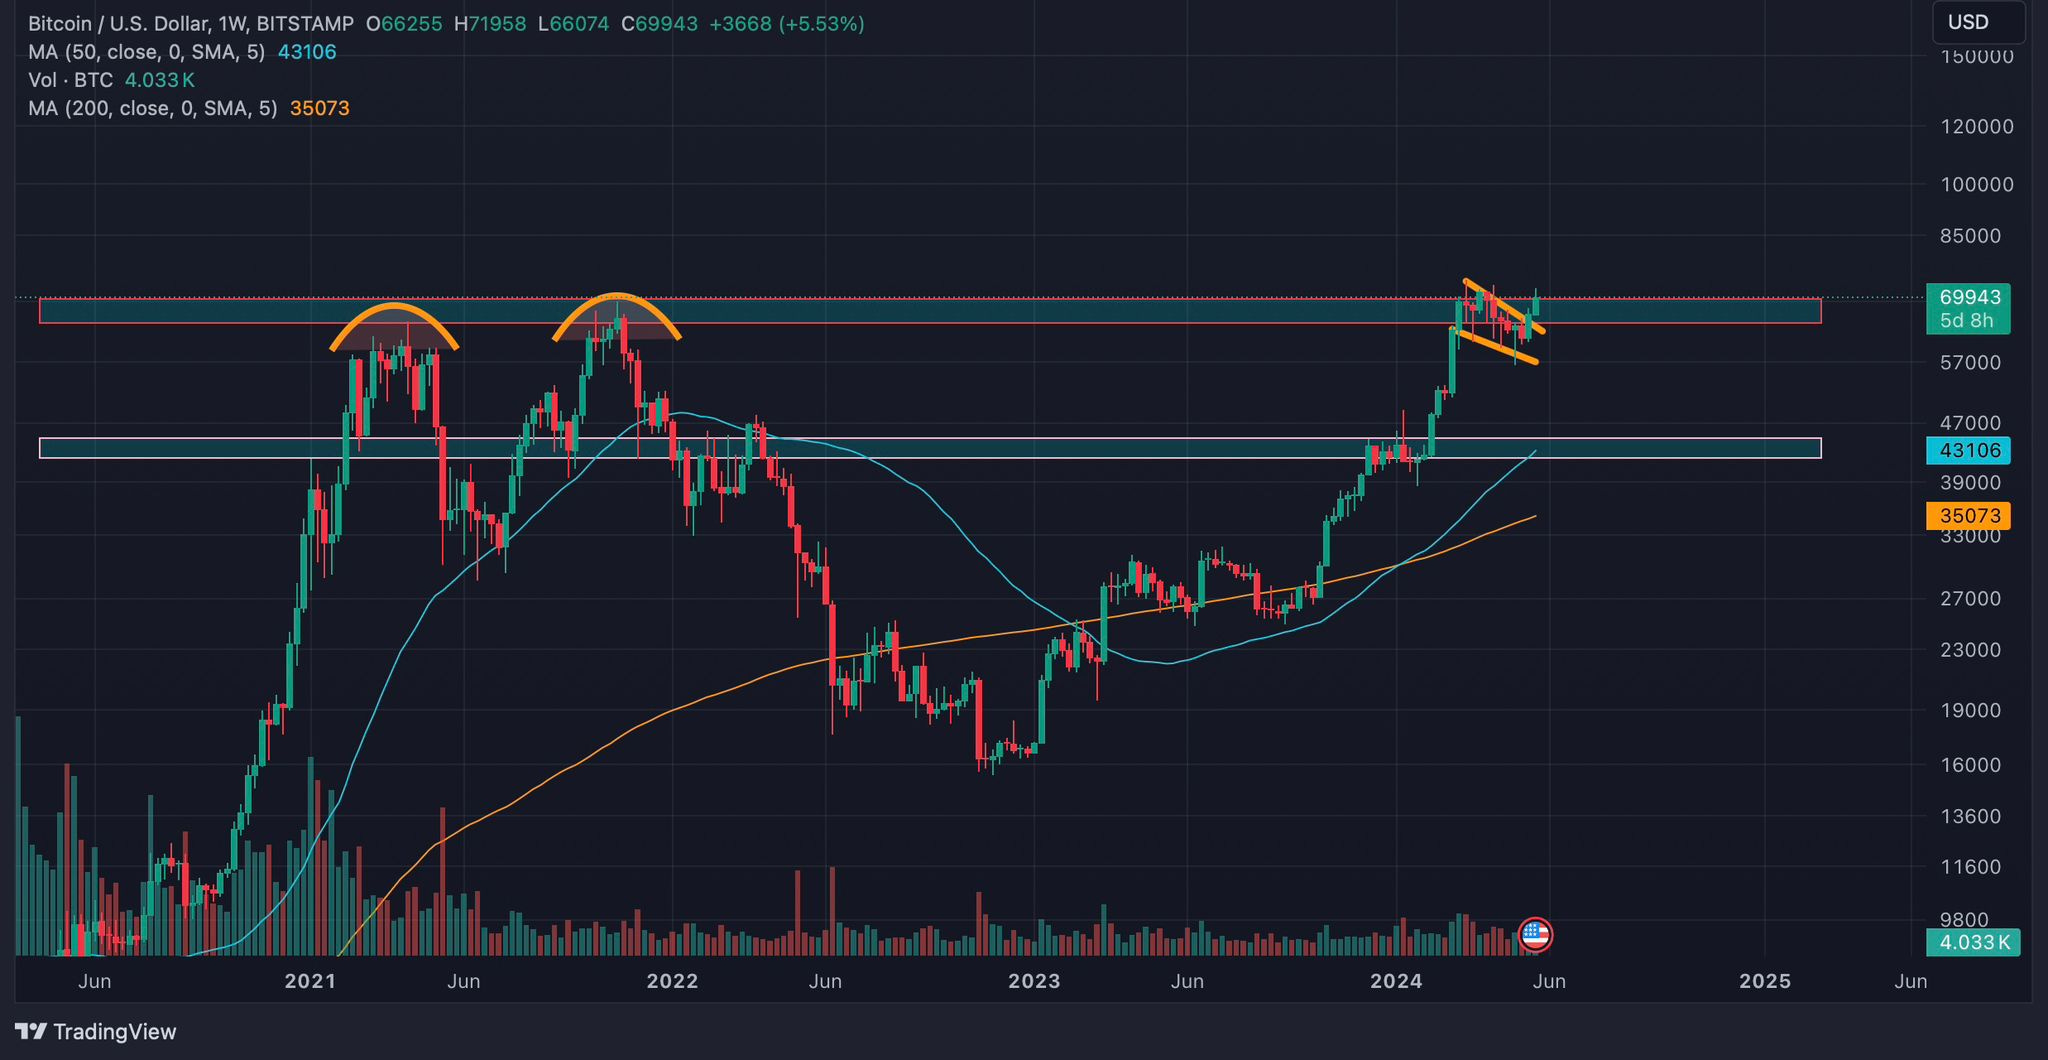
Bitcoin has seen a resurgence over the past year, rising by over 130%. and reaching a new all-time high of over $73,000, surpassing the previous high of $69,000. Since achieving these new heights, the cryptocurrency market has consolidated since March. However, Bitcoin's chart reveals more intriguing developments.
A well-defined bull flag has formed on Bitcoins weekly chart, currently breaking out! This is a much different setup compared to what we saw at this same level back in 2021. The flag formation on declining volume suggests potential for further upside is brewing!
Contrary to the assumption that Bitcoin, near its all-time highs, would be trading in overbought territory, the Relative Strength Index (RSI) tells a different story. The RSI is currently at its lowest point on the weekly timeframe since October 2023 (62), which is down from its peak of 83 in March! With this breakout, Bitcoin could potentially reach upwards of $80,000.
Tesla $TSLA (Inverse H&S)
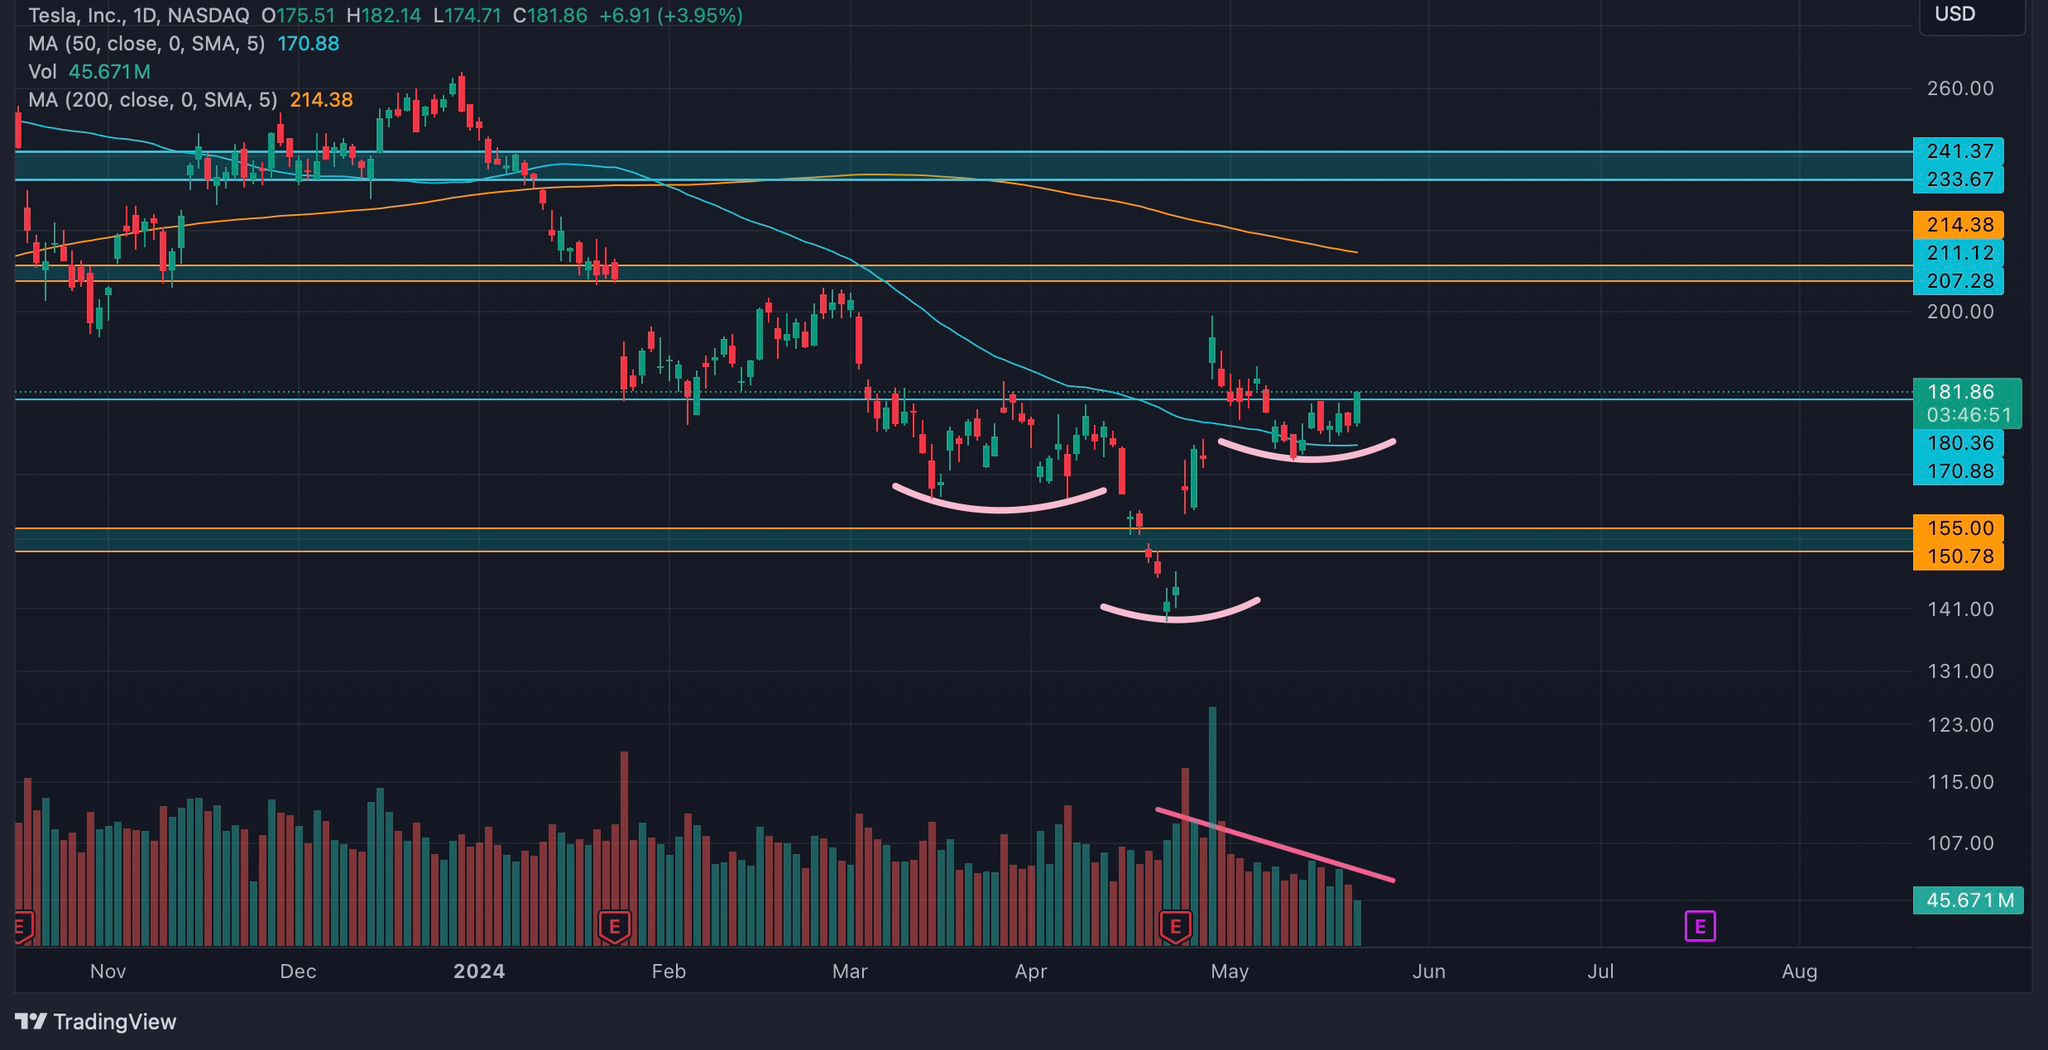
Tesla has had a challenging start to the year, but there are signs of hope for the bulls following its earnings pop. An inverse head and shoulders pattern is forming on declining volume. The stock recently filled one of its gaps and has been holding that level as support since mid-last week at around $170. Despite recent weakness, this pattern suggests a potential bounce, even if temporary.
Additionally, a bullish divergence on the RSI can be seen. This means that as the stock price has made lower lows, the RSI has made higher lows, indicating potential bullish momentum. The RSI currently sits at 49, providing bulls with plenty of room before reaching anywhere near overbought territory.
On a successful breakout, Tesla could likely reach over $200, with minimal resistance until the next supply zone between $207 and $211. However, failure to break out could result in a significant pullback to the $150s…
Affirm ($AFRM) Weekly Cup and Handle
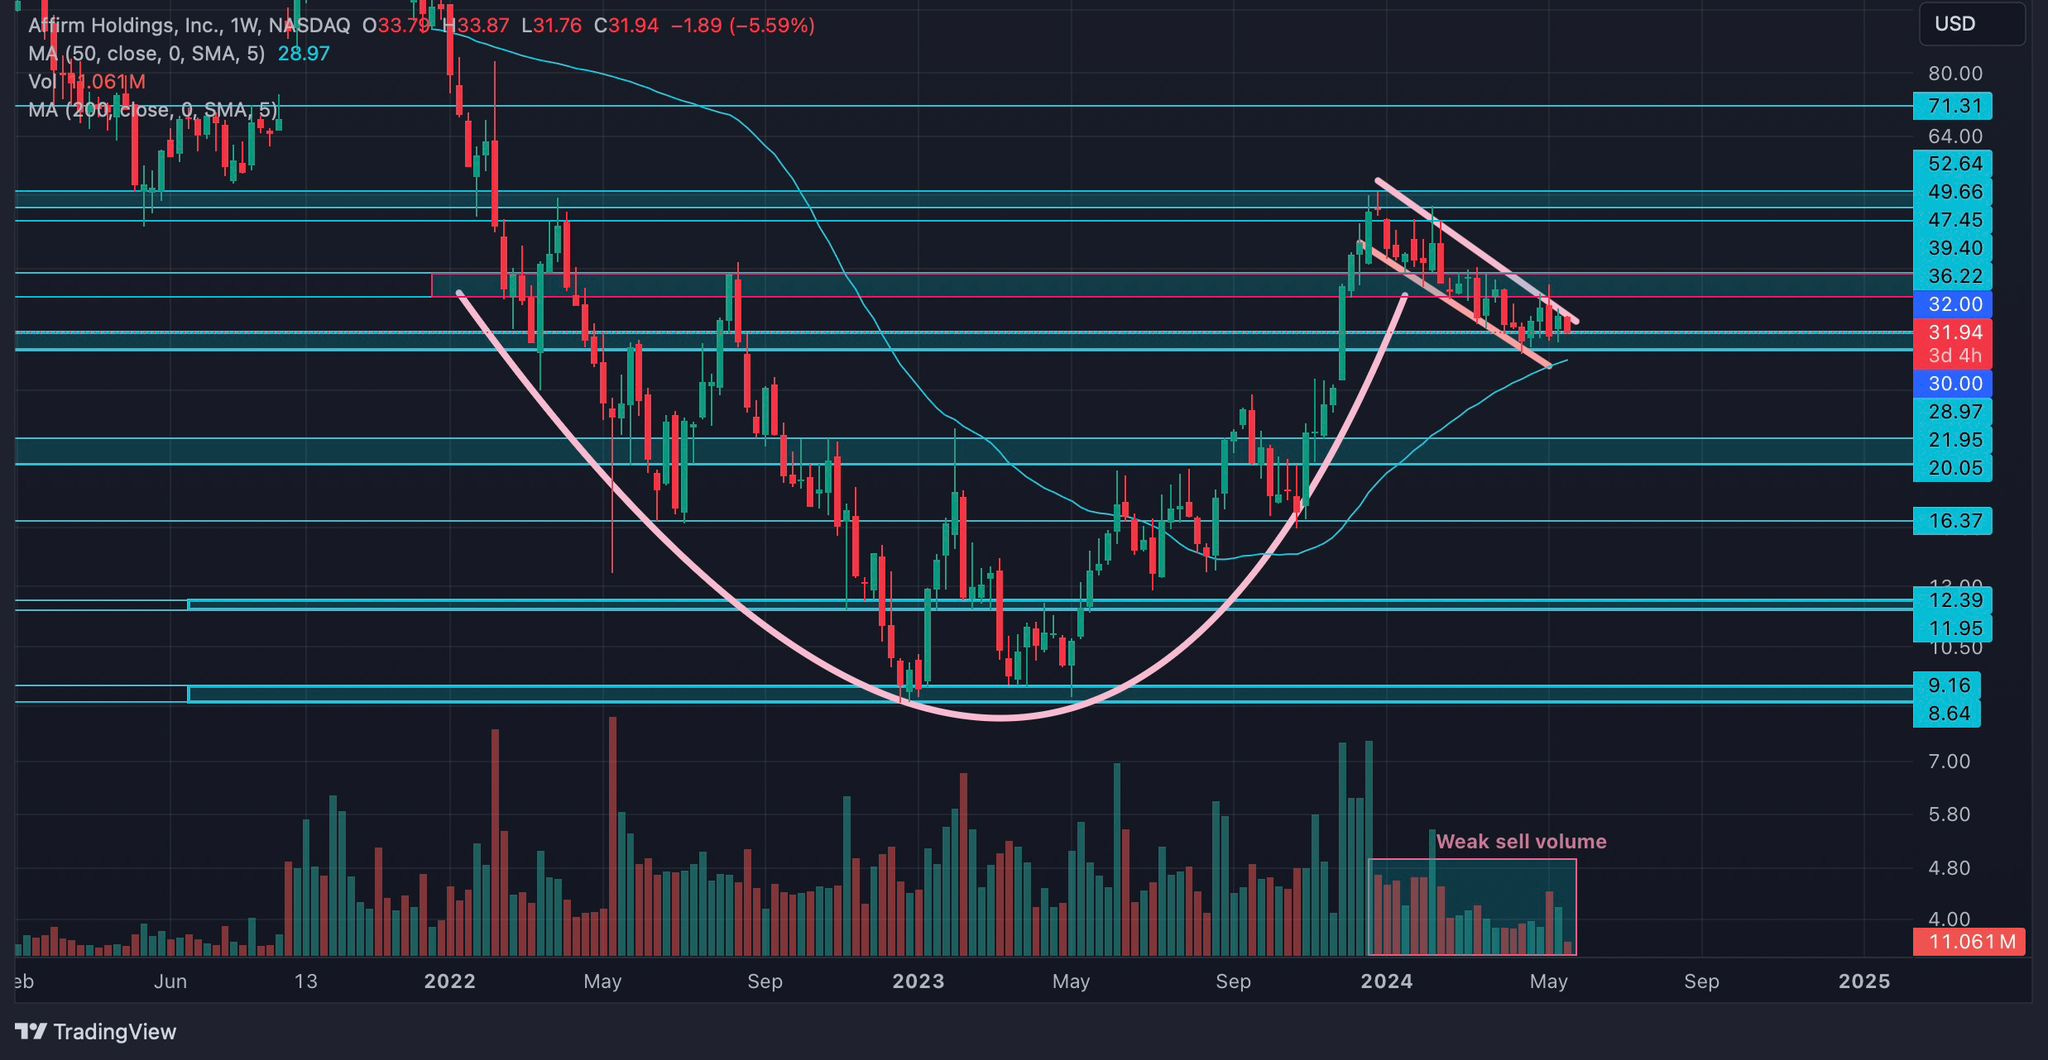
Affirm presents one of the most promising long setups in the market. The stock has formed an impressive cup and is currently trading within its handle, a common pattern following a significant decline. Affirm appears poised to test the lower part of this handle, which would also test its rising 50-week moving average (MA). There is substantial support just below $30, bolstering confidence in a bullish outcome.
During this period, the RSI has decreased significantly from its peak of 84, now trading at levels not seen since May 2023 on the weekly timeframe, currently at 47. The low sell volume during the handle formation further supports a bullish outlook. On a breakout, the first target is $50, with potential upside reaching $70, making Affirm a stock to watch for the remainder of 2024.
Duolingo ($DUOL) Weekly Triple Top
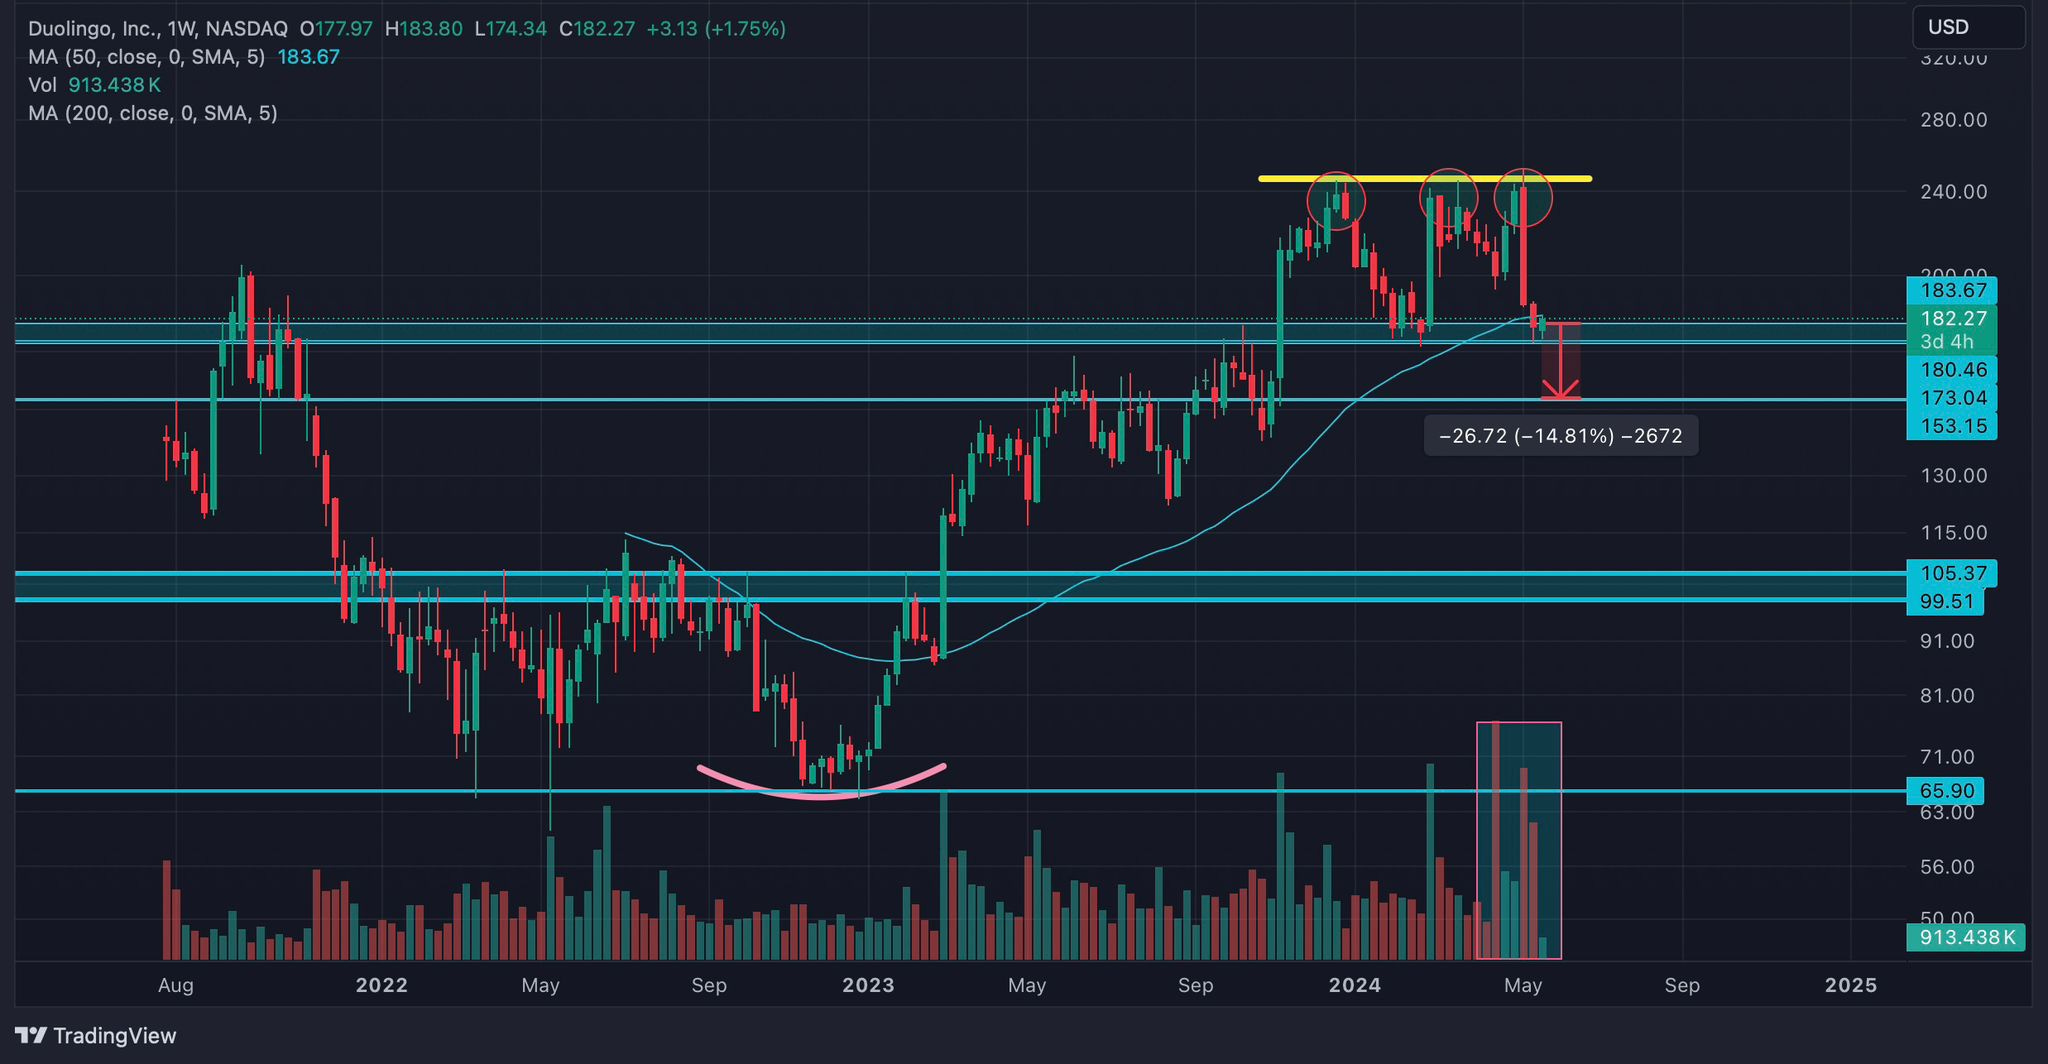
Duolingo's chart indicates potential downside risk. A triple top has formed on its weekly chart, with three consecutive rejections at the $246 level. Currently, the stock is losing its 50-week MA after briefly surpassing it in January 2023. This is one of several bearish indicators suggesting the stock may head lower.
The first target is 14% below the current stock price and 40% below its third peak at $246, putting Duolingo at $153. Given the sharp decline over the past two weeks, this target could be reached relatively quickly.
That was it for this quick chart review. Leave a like and comment below if you enjoyed this post. Sharing with your friends, colleagues, and family is much appreciated!
Make sure to give us both a follow on X if you aren’t doing so already.
@ad_investing22 and @Stock_Inf0